

r T
T Ã
¼ a 2 n
½
b2
ð3:216Þ
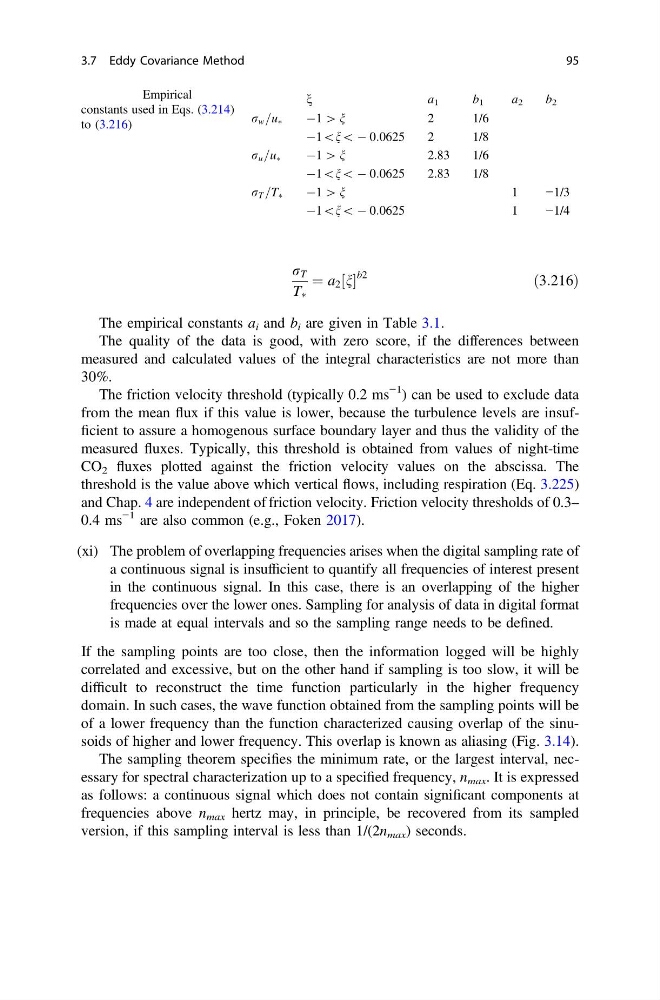
The empirical constants a i and b i are given in Table 3.1.
The quality of the data is good, with zero score, if the differences between
measured and calculated values of the integral characteristics are not more than
30%.
The friction velocity threshold (typically 0.2 ms
−1 ) can be used to exclude data
from the mean flux if this value is lower, because the turbulence levels are insufficient to assure a homogenous surface boundary layer and thus the validity of the
measured fluxes. Typically, this threshold is obtained from values of night-time
CO 2 fluxes plotted against the friction velocity values on the abscissa. The
threshold is the value above which vertical flows, including respiration (Eq. 3.225)
and Chap. 4 are independent of friction velocity. Friction velocity thresholds of 0.3–
0.4 ms
−1 are also common (e.g., Foken 2017).
(xi) The problem of overlapping frequencies arises when the digital sampling rate of
a continuous signal is insufficient to quantify all frequencies of interest present
in the continuous signal. In this case, there is an overlapping of the higher
frequencies over the lower ones. Sampling for analysis of data in digital format
is made at equal intervals and so the sampling range needs to be defined.
If the sampling points are too close, then the information logged will be highly
correlated and excessive, but on the other hand if sampling is too slow, it will be
difficult to reconstruct the time function particularly in the higher frequency
domain. In such cases, the wave function obtained from the sampling points will be
of a lower frequency than the function characterized causing overlap of the sinusoids of higher and lower frequency. This overlap is known as aliasing (Fig. 3.14).
The sampling theorem specifies the minimum rate, or the largest interval, necessary for spectral characterization up to a specified frequency, n max . It is expressed
as follows: a continuous signal which does not contain significant components at
frequencies above n max hertz may, in principle, be recovered from its sampled
version, if this sampling interval is less than 1/(2n max ) seconds.
Table 3.1 Empirical
constants used in Eqs. (3.214)
to (3.216)
n
a 1
b 1
a 2
b 2
r w =u Ã
À1 [ n
2
1/6
À1\n\ À 0:0625
2
1/8
r u =u Ã
À1 [ n
2.83
1/6
À1\n\ À 0:0625
2.83
1/8
r T =T Ã
À1 [ n
1
−1/3
À1\n\ À 0:0625
1
−1/4
3.7 Eddy Covariance Method
95
T Ã
¼ a 2 n
½
b2
ð3:216Þ
The empirical constants a i and b i are given in Table 3.1.
The quality of the data is good, with zero score, if the differences between
measured and calculated values of the integral characteristics are not more than
30%.
The friction velocity threshold (typically 0.2 ms
−1 ) can be used to exclude data
from the mean flux if this value is lower, because the turbulence levels are insufficient to assure a homogenous surface boundary layer and thus the validity of the
measured fluxes. Typically, this threshold is obtained from values of night-time
CO 2 fluxes plotted against the friction velocity values on the abscissa. The
threshold is the value above which vertical flows, including respiration (Eq. 3.225)
and Chap. 4 are independent of friction velocity. Friction velocity thresholds of 0.3–
0.4 ms
−1 are also common (e.g., Foken 2017).
(xi) The problem of overlapping frequencies arises when the digital sampling rate of
a continuous signal is insufficient to quantify all frequencies of interest present
in the continuous signal. In this case, there is an overlapping of the higher
frequencies over the lower ones. Sampling for analysis of data in digital format
is made at equal intervals and so the sampling range needs to be defined.
If the sampling points are too close, then the information logged will be highly
correlated and excessive, but on the other hand if sampling is too slow, it will be
difficult to reconstruct the time function particularly in the higher frequency
domain. In such cases, the wave function obtained from the sampling points will be
of a lower frequency than the function characterized causing overlap of the sinusoids of higher and lower frequency. This overlap is known as aliasing (Fig. 3.14).
The sampling theorem specifies the minimum rate, or the largest interval, necessary for spectral characterization up to a specified frequency, n max . It is expressed
as follows: a continuous signal which does not contain significant components at
frequencies above n max hertz may, in principle, be recovered from its sampled
version, if this sampling interval is less than 1/(2n max ) seconds.
Table 3.1 Empirical
constants used in Eqs. (3.214)
to (3.216)
n
a 1
b 1
a 2
b 2
r w =u Ã
À1 [ n
2
1/6
À1\n\ À 0:0625
2
1/8
r u =u Ã
À1 [ n
2.83
1/6
À1\n\ À 0:0625
2.83
1/8
r T =T Ã
À1 [ n
1
−1/3
À1\n\ À 0:0625
1
−1/4
3.7 Eddy Covariance Method
95