

39
4.4.2 SDG2: Zero Hunger
SDG2
Data
N
Minimum
Maximum
Mean
Houston
Food insecurity
%
100
7.9
20.6
13.4
16.3
Pop obese
%
100
19.1
34.4
27.9
26.9
Source: (Espey et al. 2018). Food insecurity 2014 data. Population obese 2013 data
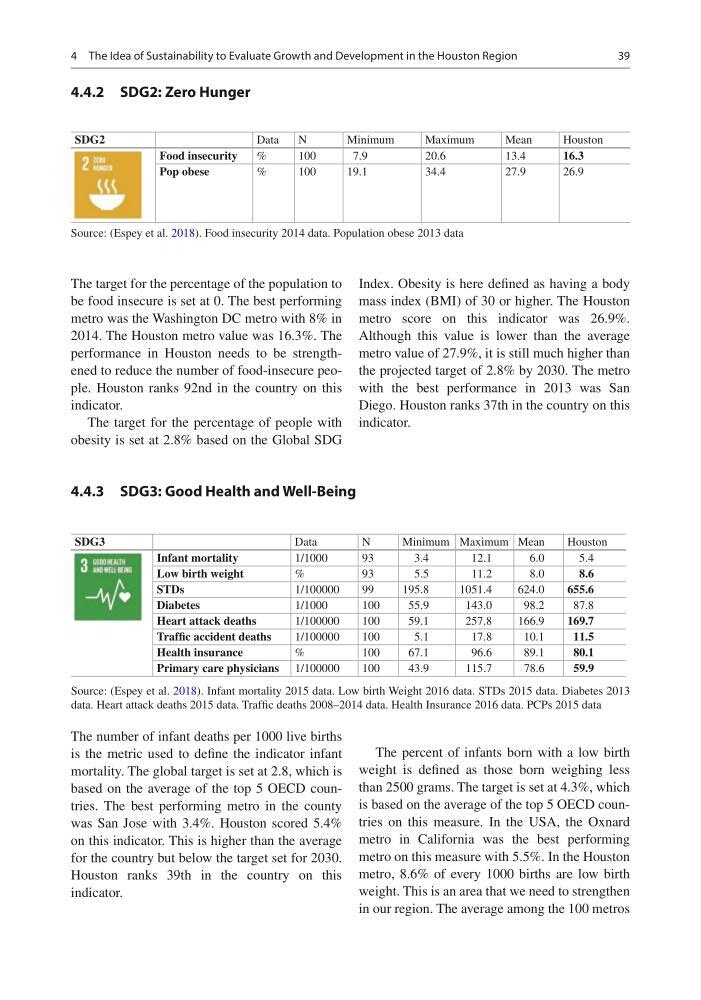
The target for the percentage of the population to
be food insecure is set at 0. The best performing
metro was the Washington DC metro with 8% in
2014. The Houston metro value was 16.3%. The
performance in Houston needs to be strengthened to reduce the number of food-insecure people. Houston ranks 92nd in the country on this
indicator.
The target for the percentage of people with
obesity is set at 2.8% based on the Global SDG
Index. Obesity is here defined as having a body
mass index (BMI) of 30 or higher. The Houston
metro score on this indicator was 26.9%.
Although this value is lower than the average
metro value of 27.9%, it is still much higher than
the projected target of 2.8% by 2030. The metro
with the best performance in 2013 was San
Diego. Houston ranks 37th in the country on this
indicator.
4.4.3 SDG3: Good Health and Well-Being
SDG3
Data
N
Minimum Maximum Mean
Houston
Infant mortality
1/1000
93
3.4
12.1
6.0
5.4
Low birth weight
%
93
5.5
11.2
8.0
8.6
STDs
1/100000
99
195.8
1051.4
624.0
655.6
Diabetes
1/1000
100
55.9
143.0
98.2
87.8
Heart attack deaths
1/100000
100
59.1
257.8
166.9
169.7
Traffic accident deaths
1/100000
100
5.1
17.8
10.1
11.5
Health insurance
%
100
67.1
96.6
89.1
80.1
Primary care physicians 1/100000
100
43.9
115.7
78.6
59.9
Source: (Espey et al. 2018). Infant mortality 2015 data. Low birth Weight 2016 data. STDs 2015 data. Diabetes 2013
data. Heart attack deaths 2015 data. Traffic deaths 2008–2014 data. Health Insurance 2016 data. PCPs 2015 data
The number of infant deaths per 1000 live births
is the metric used to define the indicator infant
mortality. The global target is set at 2.8, which is
based on the average of the top 5 OECD countries. The best performing metro in the county
was San Jose with 3.4%. Houston scored 5.4%
on this indicator. This is higher than the average
for the country but below the target set for 2030.
Houston ranks 39th in the country on this
indicator.
The percent of infants born with a low birth
weight is defined as those born weighing less
than 2500 grams. The target is set at 4.3%, which
is based on the average of the top 5 OECD countries on this measure. In the USA, the Oxnard
metro in California was the best performing
metro on this measure with 5.5%. In the Houston
metro, 8.6% of every 1000 births are low birth
weight. This is an area that we need to strengthen
in our region. The average among the 100 metros
4 The Idea of Sustainability to Evaluate Growth and Development in the Houston Region
4.4.2 SDG2: Zero Hunger
SDG2
Data
N
Minimum
Maximum
Mean
Houston
Food insecurity
%
100
7.9
20.6
13.4
16.3
Pop obese
%
100
19.1
34.4
27.9
26.9
Source: (Espey et al. 2018). Food insecurity 2014 data. Population obese 2013 data
The target for the percentage of the population to
be food insecure is set at 0. The best performing
metro was the Washington DC metro with 8% in
2014. The Houston metro value was 16.3%. The
performance in Houston needs to be strengthened to reduce the number of food-insecure people. Houston ranks 92nd in the country on this
indicator.
The target for the percentage of people with
obesity is set at 2.8% based on the Global SDG
Index. Obesity is here defined as having a body
mass index (BMI) of 30 or higher. The Houston
metro score on this indicator was 26.9%.
Although this value is lower than the average
metro value of 27.9%, it is still much higher than
the projected target of 2.8% by 2030. The metro
with the best performance in 2013 was San
Diego. Houston ranks 37th in the country on this
indicator.
4.4.3 SDG3: Good Health and Well-Being
SDG3
Data
N
Minimum Maximum Mean
Houston
Infant mortality
1/1000
93
3.4
12.1
6.0
5.4
Low birth weight
%
93
5.5
11.2
8.0
8.6
STDs
1/100000
99
195.8
1051.4
624.0
655.6
Diabetes
1/1000
100
55.9
143.0
98.2
87.8
Heart attack deaths
1/100000
100
59.1
257.8
166.9
169.7
Traffic accident deaths
1/100000
100
5.1
17.8
10.1
11.5
Health insurance
%
100
67.1
96.6
89.1
80.1
Primary care physicians 1/100000
100
43.9
115.7
78.6
59.9
Source: (Espey et al. 2018). Infant mortality 2015 data. Low birth Weight 2016 data. STDs 2015 data. Diabetes 2013
data. Heart attack deaths 2015 data. Traffic deaths 2008–2014 data. Health Insurance 2016 data. PCPs 2015 data
The number of infant deaths per 1000 live births
is the metric used to define the indicator infant
mortality. The global target is set at 2.8, which is
based on the average of the top 5 OECD countries. The best performing metro in the county
was San Jose with 3.4%. Houston scored 5.4%
on this indicator. This is higher than the average
for the country but below the target set for 2030.
Houston ranks 39th in the country on this
indicator.
The percent of infants born with a low birth
weight is defined as those born weighing less
than 2500 grams. The target is set at 4.3%, which
is based on the average of the top 5 OECD countries on this measure. In the USA, the Oxnard
metro in California was the best performing
metro on this measure with 5.5%. In the Houston
metro, 8.6% of every 1000 births are low birth
weight. This is an area that we need to strengthen
in our region. The average among the 100 metros
4 The Idea of Sustainability to Evaluate Growth and Development in the Houston Region