

38
measures in the study and the 2030 SDG target
all metros should be aiming policies and programs to meet.
4.4.1 SDG1: No Poverty
Poverty rates in Houston are increasing (GHP
2019). Here we measure (1) the number of people in poverty and (2) average incomes and (3)
we focus on children in poverty. In 2010, the City
of Houston had a higher poverty rate (22.8%)
than its county seat Harris County and then in
turn the State of Texas (16.8% for both). The percent of people below the poverty line in the USA
was 13.8% (US Census Bureau, 2010). This
range, from the mostly urban city of Houston to
the mostly rural State of Texas, suggests that
interventions in the region need to have sensitivity between different types of geographies such
as urban cities vs suburban and rural cities. The
City of Houston is projected to have 24% of its
population in poverty by 2030 unless major interventions are enacted (King 2012).
SDG1
Data
N
Minimum Maximum Mean
Houston
Pop below poverty
%
100
8.4
32.8
14.5
15.3
Income
$/capita 99
24,805.0
106,666.0
48,758.9
51,900.4
Children x2 below
poverty line
%
99
25.2
69.7
41.0
40.7
Source: (Espey et al. 2018) Based on 2016 data
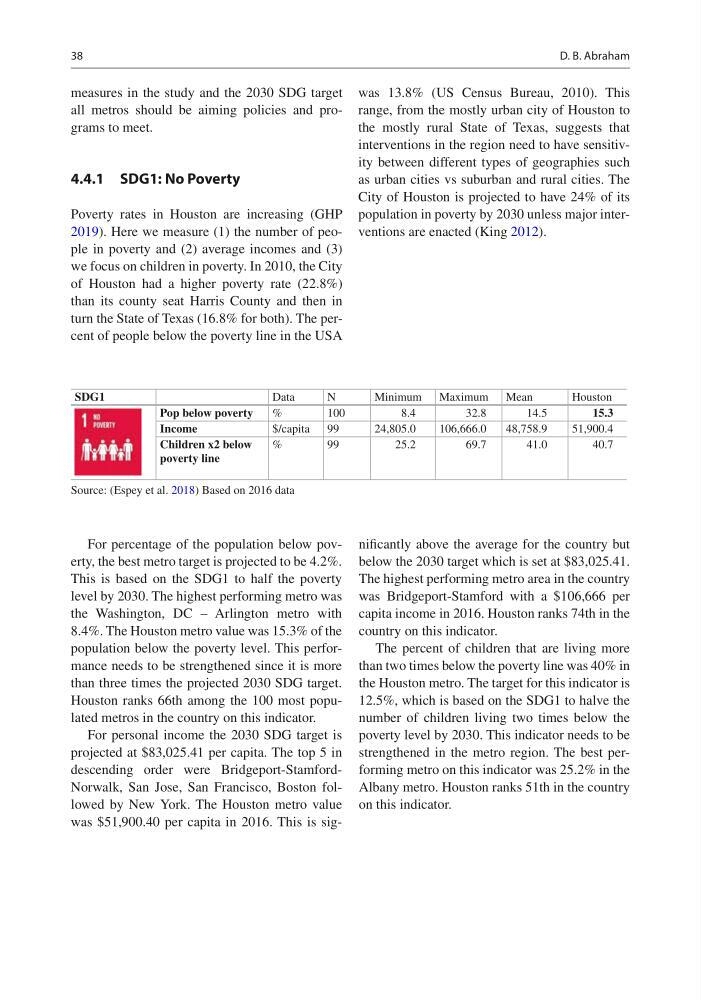
For percentage of the population below poverty, the best metro target is projected to be 4.2%.
This is based on the SDG1 to half the poverty
level by 2030. The highest performing metro was
the Washington, DC – Arlington metro with
8.4%. The Houston metro value was 15.3% of the
population below the poverty level. This performance needs to be strengthened since it is more
than three times the projected 2030 SDG target.
Houston ranks 66th among the 100 most populated metros in the country on this indicator.
For personal income the 2030 SDG target is
projected at $83,025.41 per capita. The top 5 in
descending order were Bridgeport-StamfordNorwalk, San Jose, San Francisco, Boston followed by New York. The Houston metro value
was $51,900.40 per capita in 2016. This is significantly above the average for the country but
below the 2030 target which is set at $83,025.41.
The highest performing metro area in the country
was Bridgeport-Stamford with a $106,666 per
capita income in 2016. Houston ranks 74th in the
country on this indicator.
The percent of children that are living more
than two times below the poverty line was 40% in
the Houston metro. The target for this indicator is
12.5%, which is based on the SDG1 to halve the
number of children living two times below the
poverty level by 2030. This indicator needs to be
strengthened in the metro region. The best performing metro on this indicator was 25.2% in the
Albany metro. Houston ranks 51th in the country
on this indicator.
D. B. Abraham
measures in the study and the 2030 SDG target
all metros should be aiming policies and programs to meet.
4.4.1 SDG1: No Poverty
Poverty rates in Houston are increasing (GHP
2019). Here we measure (1) the number of people in poverty and (2) average incomes and (3)
we focus on children in poverty. In 2010, the City
of Houston had a higher poverty rate (22.8%)
than its county seat Harris County and then in
turn the State of Texas (16.8% for both). The percent of people below the poverty line in the USA
was 13.8% (US Census Bureau, 2010). This
range, from the mostly urban city of Houston to
the mostly rural State of Texas, suggests that
interventions in the region need to have sensitivity between different types of geographies such
as urban cities vs suburban and rural cities. The
City of Houston is projected to have 24% of its
population in poverty by 2030 unless major interventions are enacted (King 2012).
SDG1
Data
N
Minimum Maximum Mean
Houston
Pop below poverty
%
100
8.4
32.8
14.5
15.3
Income
$/capita 99
24,805.0
106,666.0
48,758.9
51,900.4
Children x2 below
poverty line
%
99
25.2
69.7
41.0
40.7
Source: (Espey et al. 2018) Based on 2016 data
For percentage of the population below poverty, the best metro target is projected to be 4.2%.
This is based on the SDG1 to half the poverty
level by 2030. The highest performing metro was
the Washington, DC – Arlington metro with
8.4%. The Houston metro value was 15.3% of the
population below the poverty level. This performance needs to be strengthened since it is more
than three times the projected 2030 SDG target.
Houston ranks 66th among the 100 most populated metros in the country on this indicator.
For personal income the 2030 SDG target is
projected at $83,025.41 per capita. The top 5 in
descending order were Bridgeport-StamfordNorwalk, San Jose, San Francisco, Boston followed by New York. The Houston metro value
was $51,900.40 per capita in 2016. This is significantly above the average for the country but
below the 2030 target which is set at $83,025.41.
The highest performing metro area in the country
was Bridgeport-Stamford with a $106,666 per
capita income in 2016. Houston ranks 74th in the
country on this indicator.
The percent of children that are living more
than two times below the poverty line was 40% in
the Houston metro. The target for this indicator is
12.5%, which is based on the SDG1 to halve the
number of children living two times below the
poverty level by 2030. This indicator needs to be
strengthened in the metro region. The best performing metro on this indicator was 25.2% in the
Albany metro. Houston ranks 51th in the country
on this indicator.
D. B. Abraham