

120
see in the following analysis, it will be more
important to test the relationship between both
indices (and their correspondence with code violations) to see if they are estimated in a similar
way independently of the age groups.
The following results are presented in a general and disaggregated manner to show the results
based on type and occupancy of units.
The one-way ANOVA result for both owneroccupied and rental units shows a statistically
significant difference (see Table 9.8) between
group means (F (9,291) = 7.06, p = .000). A
Tukey post hoc test revealed that there was a
statistically significant difference among the
age groups from 18 through 22.
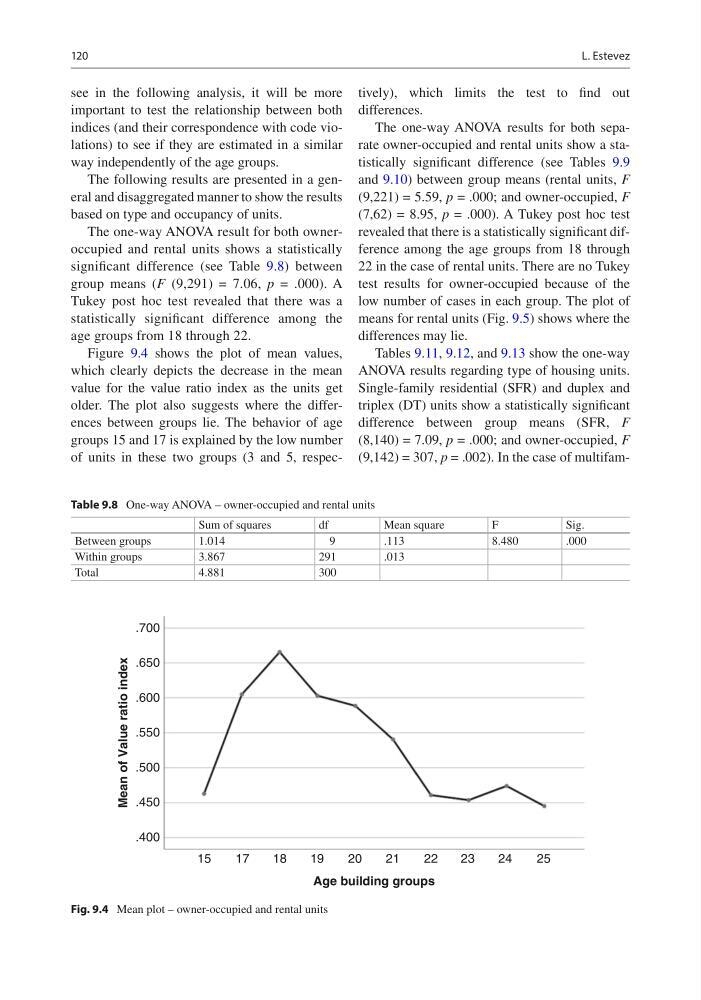
Figure 9.4 shows the plot of mean values,
which clearly depicts the decrease in the mean
value for the value ratio index as the units get
older. The plot also suggests where the differences between groups lie. The behavior of age
groups 15 and 17 is explained by the low number
of units in these two groups (3 and 5, respectively), which limits the test to find out
differences.
The one-way ANOVA results for both separate owner-occupied and rental units show a statistically significant difference (see Tables 9.9
and 9.10) between group means (rental units, F
(9,221) = 5.59, p = .000; and owner-occupied, F
(7,62) = 8.95, p = .000). A Tukey post hoc test
revealed that there is a statistically significant difference among the age groups from 18 through
22 in the case of rental units. There are no Tukey
test results for owner-occupied because of the
low number of cases in each group. The plot of
means for rental units (Fig. 9.5) shows where the
differences may lie.
Tables 9.11, 9.12, and 9.13 show the one-way
ANOVA results regarding type of housing units.
Single-family residential (SFR) and duplex and
triplex (DT) units show a statistically significant
difference between group means (SFR, F
(8,140) = 7.09, p = .000; and owner-occupied, F
(9,142) = 307, p = .002). In the case of multifam.700
.650
.550
.450
.400
.500
.600
15
17
18
19
20
21
22
23
24
25
Age building groups
Mean of Value ratio index
Fig. 9.4 Mean plot – owner-occupied and rental units
Table 9.8 One-way ANOVA – owner-occupied and rental units
Sum of squares
df
Mean square
F
Sig.
Between groups
1.014
9
.113
8.480
.000
Within groups
3.867
291
.013
Total
4.881
300
L. Estevez
see in the following analysis, it will be more
important to test the relationship between both
indices (and their correspondence with code violations) to see if they are estimated in a similar
way independently of the age groups.
The following results are presented in a general and disaggregated manner to show the results
based on type and occupancy of units.
The one-way ANOVA result for both owneroccupied and rental units shows a statistically
significant difference (see Table 9.8) between
group means (F (9,291) = 7.06, p = .000). A
Tukey post hoc test revealed that there was a
statistically significant difference among the
age groups from 18 through 22.
Figure 9.4 shows the plot of mean values,
which clearly depicts the decrease in the mean
value for the value ratio index as the units get
older. The plot also suggests where the differences between groups lie. The behavior of age
groups 15 and 17 is explained by the low number
of units in these two groups (3 and 5, respectively), which limits the test to find out
differences.
The one-way ANOVA results for both separate owner-occupied and rental units show a statistically significant difference (see Tables 9.9
and 9.10) between group means (rental units, F
(9,221) = 5.59, p = .000; and owner-occupied, F
(7,62) = 8.95, p = .000). A Tukey post hoc test
revealed that there is a statistically significant difference among the age groups from 18 through
22 in the case of rental units. There are no Tukey
test results for owner-occupied because of the
low number of cases in each group. The plot of
means for rental units (Fig. 9.5) shows where the
differences may lie.
Tables 9.11, 9.12, and 9.13 show the one-way
ANOVA results regarding type of housing units.
Single-family residential (SFR) and duplex and
triplex (DT) units show a statistically significant
difference between group means (SFR, F
(8,140) = 7.09, p = .000; and owner-occupied, F
(9,142) = 307, p = .002). In the case of multifam.700
.650
.550
.450
.400
.500
.600
15
17
18
19
20
21
22
23
24
25
Age building groups
Mean of Value ratio index
Fig. 9.4 Mean plot – owner-occupied and rental units
Table 9.8 One-way ANOVA – owner-occupied and rental units
Sum of squares
df
Mean square
F
Sig.
Between groups
1.014
9
.113
8.480
.000
Within groups
3.867
291
.013
Total
4.881
300
L. Estevez