

119
for the total of units when considering both
owner-occupied and rental together, rental units,
single family, duplexes, and triplexes. Where the
proportions were different was for owneroccupied only and multifamily. It is important to
note the low number of units present in these two
categories (owner-occupied represented 23% and
multifamily 17%). This lower number could
explain the discrepancies in the estimates for
both indices.
9.4.1 Testing the Significance
of Differences Across Age
for Units
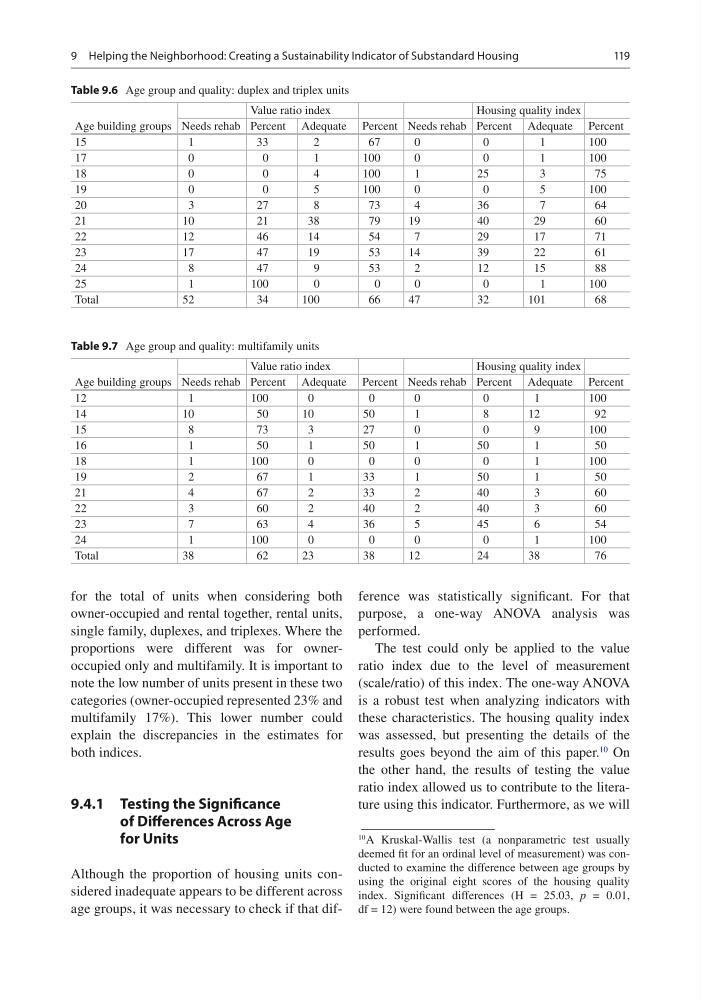
Although the proportion of housing units considered inadequate appears to be different across
age groups, it was necessary to check if that difference was statistically significant. For that
purpose, a one-way ANOVA analysis was
performed.
The test could only be applied to the value
ratio index due to the level of measurement
(scale/ratio) of this index. The one-way ANOVA
is a robust test when analyzing indicators with
these characteristics. The housing quality index
was assessed, but presenting the details of the
results goes beyond the aim of this paper.
10
On
the other hand, the results of testing the value
ratio index allowed us to contribute to the literature using this indicator. Furthermore, as we will
10 A Kruskal-Wallis test (a nonparametric test usually
deemed fit for an ordinal level of measurement) was conducted to examine the difference between age groups by
using the original eight scores of the housing quality
index. Significant differences (H = 25.03, p = 0.01,
df = 12) were found between the age groups.
Table 9.6 Age group and quality: duplex and triplex units
Age building groups
Value ratio index
Housing quality index
Needs rehab Percent Adequate Percent Needs rehab Percent Adequate Percent
15
1
33
2
67
0
0
1
100
17
0
0
1
100
0
0
1
100
18
0
0
4
100
1
25
3
75
19
0
0
5
100
0
0
5
100
20
3
27
8
73
4
36
7
64
21
10
21
38
79
19
40
29
60
22
12
46
14
54
7
29
17
71
23
17
47
19
53
14
39
22
61
24
8
47
9
53
2
12
15
88
25
1
100
0
0
0
0
1
100
Total
52
34
100
66
47
32
101
68
Table 9.7 Age group and quality: multifamily units
Age building groups
Value ratio index
Housing quality index
Needs rehab Percent Adequate Percent Needs rehab Percent Adequate Percent
12
1
100
0
0
0
0
1
100
14
10
50
10
50
1
8
12
92
15
8
73
3
27
0
0
9
100
16
1
50
1
50
1
50
1
50
18
1
100
0
0
0
0
1
100
19
2
67
1
33
1
50
1
50
21
4
67
2
33
2
40
3
60
22
3
60
2
40
2
40
3
60
23
7
63
4
36
5
45
6
54
24
1
100
0
0
0
0
1
100
Total
38
62
23
38
12
24
38
76
9 Helping the Neighborhood: Creating a Sustainability Indicator of Substandard Housing
for the total of units when considering both
owner-occupied and rental together, rental units,
single family, duplexes, and triplexes. Where the
proportions were different was for owneroccupied only and multifamily. It is important to
note the low number of units present in these two
categories (owner-occupied represented 23% and
multifamily 17%). This lower number could
explain the discrepancies in the estimates for
both indices.
9.4.1 Testing the Significance
of Differences Across Age
for Units
Although the proportion of housing units considered inadequate appears to be different across
age groups, it was necessary to check if that difference was statistically significant. For that
purpose, a one-way ANOVA analysis was
performed.
The test could only be applied to the value
ratio index due to the level of measurement
(scale/ratio) of this index. The one-way ANOVA
is a robust test when analyzing indicators with
these characteristics. The housing quality index
was assessed, but presenting the details of the
results goes beyond the aim of this paper.
10
On
the other hand, the results of testing the value
ratio index allowed us to contribute to the literature using this indicator. Furthermore, as we will
10 A Kruskal-Wallis test (a nonparametric test usually
deemed fit for an ordinal level of measurement) was conducted to examine the difference between age groups by
using the original eight scores of the housing quality
index. Significant differences (H = 25.03, p = 0.01,
df = 12) were found between the age groups.
Table 9.6 Age group and quality: duplex and triplex units
Age building groups
Value ratio index
Housing quality index
Needs rehab Percent Adequate Percent Needs rehab Percent Adequate Percent
15
1
33
2
67
0
0
1
100
17
0
0
1
100
0
0
1
100
18
0
0
4
100
1
25
3
75
19
0
0
5
100
0
0
5
100
20
3
27
8
73
4
36
7
64
21
10
21
38
79
19
40
29
60
22
12
46
14
54
7
29
17
71
23
17
47
19
53
14
39
22
61
24
8
47
9
53
2
12
15
88
25
1
100
0
0
0
0
1
100
Total
52
34
100
66
47
32
101
68
Table 9.7 Age group and quality: multifamily units
Age building groups
Value ratio index
Housing quality index
Needs rehab Percent Adequate Percent Needs rehab Percent Adequate Percent
12
1
100
0
0
0
0
1
100
14
10
50
10
50
1
8
12
92
15
8
73
3
27
0
0
9
100
16
1
50
1
50
1
50
1
50
18
1
100
0
0
0
0
1
100
19
2
67
1
33
1
50
1
50
21
4
67
2
33
2
40
3
60
22
3
60
2
40
2
40
3
60
23
7
63
4
36
5
45
6
54
24
1
100
0
0
0
0
1
100
Total
38
62
23
38
12
24
38
76
9 Helping the Neighborhood: Creating a Sustainability Indicator of Substandard Housing