

42
J. W. Owsi´ nski et al.
6 Some Comments on the Relation to Indicator Dimension
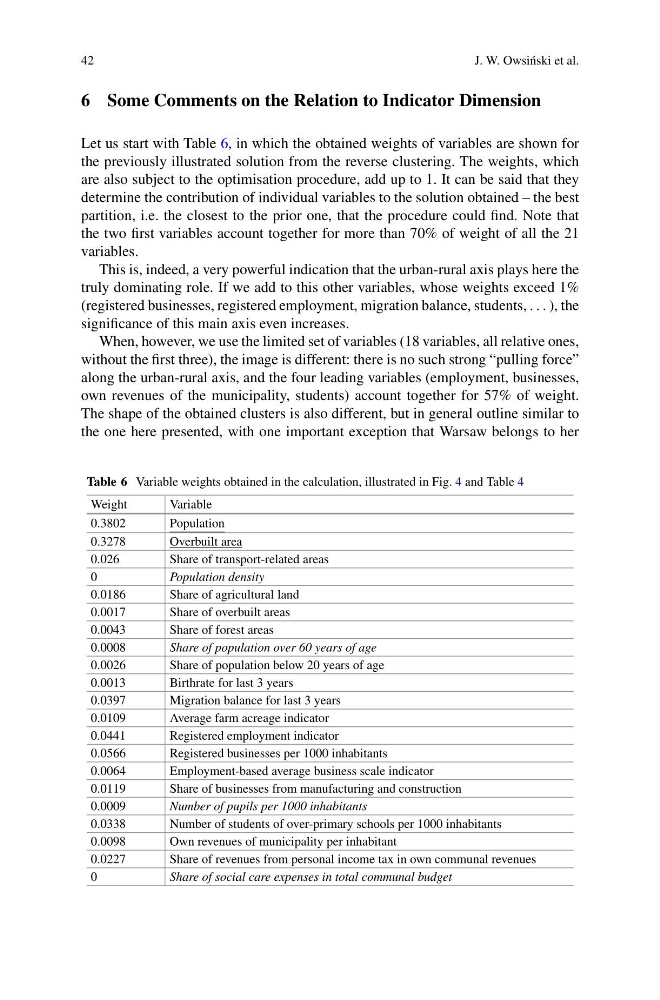
Let us start with Table 6, in which the obtained weights of variables are shown for
the previously illustrated solution from the reverse clustering. The weights, which
are also subject to the optimisation procedure, add up to 1. It can be said that they
determine the contribution of individual variables to the solution obtained – the best
partition, i.e. the closest to the prior one, that the procedure could find. Note that
the two first variables account together for more than 70% of weight of all the 21
variables.
This is, indeed, a very powerful indication that the urban-rural axis plays here the
truly dominating role. If we add to this other variables, whose weights exceed 1%
(registered businesses, registered employment, migration balance, students, . . . ), the
significance of this main axis even increases.
When, however, we use the limited set of variables (18 variables, all relative ones,
without the first three), the image is different: there is no such strong “pulling force”
along the urban-rural axis, and the four leading variables (employment, businesses,
own revenues of the municipality, students) account together for 57% of weight.
The shape of the obtained clusters is also different, but in general outline similar to
the one here presented, with one important exception that Warsaw belongs to her
Table 6 Variable weights obtained in the calculation, illustrated in Fig. 4 and Table 4
Weight
Variable
0.3802
Population
0.3278
Overbuilt area
0.026
Share of transport-related areas
0
Population density
0.0186
Share of agricultural land
0.0017
Share of overbuilt areas
0.0043
Share of forest areas
0.0008
Share of population over 60 years of age
0.0026
Share of population below 20 years of age
0.0013
Birthrate for last 3 years
0.0397
Migration balance for last 3 years
0.0109
Average farm acreage indicator
0.0441
Registered employment indicator
0.0566
Registered businesses per 1000 inhabitants
0.0064
Employment-based average business scale indicator
0.0119
Share of businesses from manufacturing and construction
0.0009
Number of pupils per 1000 inhabitants
0.0338
Number of students of over-primary schools per 1000 inhabitants
0.0098
Own revenues of municipality per inhabitant
0.0227
Share of revenues from personal income tax in own communal revenues
0
Share of social care expenses in total communal budget
J. W. Owsi´ nski et al.
6 Some Comments on the Relation to Indicator Dimension
Let us start with Table 6, in which the obtained weights of variables are shown for
the previously illustrated solution from the reverse clustering. The weights, which
are also subject to the optimisation procedure, add up to 1. It can be said that they
determine the contribution of individual variables to the solution obtained – the best
partition, i.e. the closest to the prior one, that the procedure could find. Note that
the two first variables account together for more than 70% of weight of all the 21
variables.
This is, indeed, a very powerful indication that the urban-rural axis plays here the
truly dominating role. If we add to this other variables, whose weights exceed 1%
(registered businesses, registered employment, migration balance, students, . . . ), the
significance of this main axis even increases.
When, however, we use the limited set of variables (18 variables, all relative ones,
without the first three), the image is different: there is no such strong “pulling force”
along the urban-rural axis, and the four leading variables (employment, businesses,
own revenues of the municipality, students) account together for 57% of weight.
The shape of the obtained clusters is also different, but in general outline similar to
the one here presented, with one important exception that Warsaw belongs to her
Table 6 Variable weights obtained in the calculation, illustrated in Fig. 4 and Table 4
Weight
Variable
0.3802
Population
0.3278
Overbuilt area
0.026
Share of transport-related areas
0
Population density
0.0186
Share of agricultural land
0.0017
Share of overbuilt areas
0.0043
Share of forest areas
0.0008
Share of population over 60 years of age
0.0026
Share of population below 20 years of age
0.0013
Birthrate for last 3 years
0.0397
Migration balance for last 3 years
0.0109
Average farm acreage indicator
0.0441
Registered employment indicator
0.0566
Registered businesses per 1000 inhabitants
0.0064
Employment-based average business scale indicator
0.0119
Share of businesses from manufacturing and construction
0.0009
Number of pupils per 1000 inhabitants
0.0338
Number of students of over-primary schools per 1000 inhabitants
0.0098
Own revenues of municipality per inhabitant
0.0227
Share of revenues from personal income tax in own communal revenues
0
Share of social care expenses in total communal budget