

300
R. Bruggemann et al.
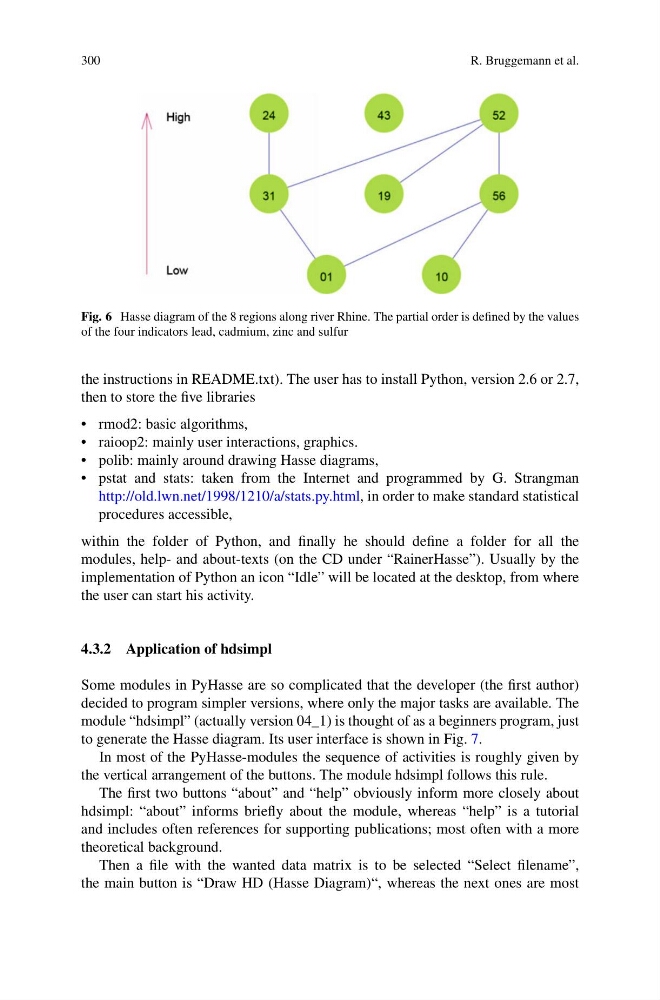
Fig. 6 Hasse diagram of the 8 regions along river Rhine. The partial order is defined by the values
of the four indicators lead, cadmium, zinc and sulfur
the instructions in README.txt). The user has to install Python, version 2.6 or 2.7,
then to store the five libraries
• rmod2: basic algorithms,
• raioop2: mainly user interactions, graphics.
• polib: mainly around drawing Hasse diagrams,
• pstat and stats: taken from the Internet and programmed by G. Strangman
http://old.lwn.net/1998/1210/a/stats.py.html, in order to make standard statistical
procedures accessible,
within the folder of Python, and finally he should define a folder for all the
modules, help- and about-texts (on the CD under “RainerHasse”). Usually by the
implementation of Python an icon “Idle” will be located at the desktop, from where
the user can start his activity.
4.3.2 Application of hdsimpl
Some modules in PyHasse are so complicated that the developer (the first author)
decided to program simpler versions, where only the major tasks are available. The
module “hdsimpl” (actually version 04_1) is thought of as a beginners program, just
to generate the Hasse diagram. Its user interface is shown in Fig. 7.
In most of the PyHasse-modules the sequence of activities is roughly given by
the vertical arrangement of the buttons. The module hdsimpl follows this rule.
The first two buttons “about” and “help” obviously inform more closely about
hdsimpl: “about” informs briefly about the module, whereas “help” is a tutorial
and includes often references for supporting publications; most often with a more
theoretical background.
Then a file with the wanted data matrix is to be selected “Select filename”,
the main button is “Draw HD (Hasse Diagram)“, whereas the next ones are most
R. Bruggemann et al.
Fig. 6 Hasse diagram of the 8 regions along river Rhine. The partial order is defined by the values
of the four indicators lead, cadmium, zinc and sulfur
the instructions in README.txt). The user has to install Python, version 2.6 or 2.7,
then to store the five libraries
• rmod2: basic algorithms,
• raioop2: mainly user interactions, graphics.
• polib: mainly around drawing Hasse diagrams,
• pstat and stats: taken from the Internet and programmed by G. Strangman
http://old.lwn.net/1998/1210/a/stats.py.html, in order to make standard statistical
procedures accessible,
within the folder of Python, and finally he should define a folder for all the
modules, help- and about-texts (on the CD under “RainerHasse”). Usually by the
implementation of Python an icon “Idle” will be located at the desktop, from where
the user can start his activity.
4.3.2 Application of hdsimpl
Some modules in PyHasse are so complicated that the developer (the first author)
decided to program simpler versions, where only the major tasks are available. The
module “hdsimpl” (actually version 04_1) is thought of as a beginners program, just
to generate the Hasse diagram. Its user interface is shown in Fig. 7.
In most of the PyHasse-modules the sequence of activities is roughly given by
the vertical arrangement of the buttons. The module hdsimpl follows this rule.
The first two buttons “about” and “help” obviously inform more closely about
hdsimpl: “about” informs briefly about the module, whereas “help” is a tutorial
and includes often references for supporting publications; most often with a more
theoretical background.
Then a file with the wanted data matrix is to be selected “Select filename”,
the main button is “Draw HD (Hasse Diagram)“, whereas the next ones are most