

272
C. Valsecchi and R. Todeschini
SAR i =
p
j =1
w j · r ij
n
(8)
DOM i =
n
m=1
1 + W +
1 + W − m = i
(9)
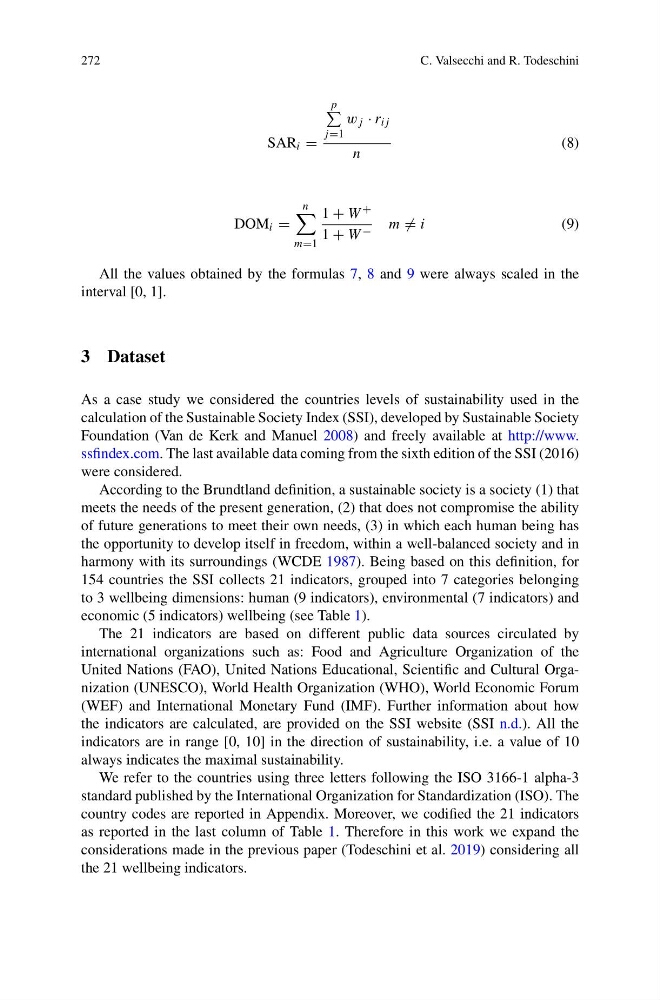
All the values obtained by the formulas 7, 8 and 9 were always scaled in the
interval [0, 1].
3 Dataset
As a case study we considered the countries levels of sustainability used in the
calculation of the Sustainable Society Index (SSI), developed by Sustainable Society
Foundation (Van de Kerk and Manuel 2008) and freely available at http://www.
ssfindex.com. The last available data coming from the sixth edition of the SSI (2016)
were considered.
According to the Brundtland definition, a sustainable society is a society (1) that
meets the needs of the present generation, (2) that does not compromise the ability
of future generations to meet their own needs, (3) in which each human being has
the opportunity to develop itself in freedom, within a well-balanced society and in
harmony with its surroundings (WCDE 1987). Being based on this definition, for
154 countries the SSI collects 21 indicators, grouped into 7 categories belonging
to 3 wellbeing dimensions: human (9 indicators), environmental (7 indicators) and
economic (5 indicators) wellbeing (see Table 1).
The 21 indicators are based on different public data sources circulated by
international organizations such as: Food and Agriculture Organization of the
United Nations (FAO), United Nations Educational, Scientific and Cultural Organization (UNESCO), World Health Organization (WHO), World Economic Forum
(WEF) and International Monetary Fund (IMF). Further information about how
the indicators are calculated, are provided on the SSI website (SSI n.d.). All the
indicators are in range [0, 10] in the direction of sustainability, i.e. a value of 10
always indicates the maximal sustainability.
We refer to the countries using three letters following the ISO 3166-1 alpha-3
standard published by the International Organization for Standardization (ISO). The
country codes are reported in Appendix. Moreover, we codified the 21 indicators
as reported in the last column of Table 1. Therefore in this work we expand the
considerations made in the previous paper (Todeschini et al. 2019) considering all
the 21 wellbeing indicators.
C. Valsecchi and R. Todeschini
SAR i =
p
j =1
w j · r ij
n
(8)
DOM i =
n
m=1
1 + W +
1 + W − m = i
(9)
All the values obtained by the formulas 7, 8 and 9 were always scaled in the
interval [0, 1].
3 Dataset
As a case study we considered the countries levels of sustainability used in the
calculation of the Sustainable Society Index (SSI), developed by Sustainable Society
Foundation (Van de Kerk and Manuel 2008) and freely available at http://www.
ssfindex.com. The last available data coming from the sixth edition of the SSI (2016)
were considered.
According to the Brundtland definition, a sustainable society is a society (1) that
meets the needs of the present generation, (2) that does not compromise the ability
of future generations to meet their own needs, (3) in which each human being has
the opportunity to develop itself in freedom, within a well-balanced society and in
harmony with its surroundings (WCDE 1987). Being based on this definition, for
154 countries the SSI collects 21 indicators, grouped into 7 categories belonging
to 3 wellbeing dimensions: human (9 indicators), environmental (7 indicators) and
economic (5 indicators) wellbeing (see Table 1).
The 21 indicators are based on different public data sources circulated by
international organizations such as: Food and Agriculture Organization of the
United Nations (FAO), United Nations Educational, Scientific and Cultural Organization (UNESCO), World Health Organization (WHO), World Economic Forum
(WEF) and International Monetary Fund (IMF). Further information about how
the indicators are calculated, are provided on the SSI website (SSI n.d.). All the
indicators are in range [0, 10] in the direction of sustainability, i.e. a value of 10
always indicates the maximal sustainability.
We refer to the countries using three letters following the ISO 3166-1 alpha-3
standard published by the International Organization for Standardization (ISO). The
country codes are reported in Appendix. Moreover, we codified the 21 indicators
as reported in the last column of Table 1. Therefore in this work we expand the
considerations made in the previous paper (Todeschini et al. 2019) considering all
the 21 wellbeing indicators.