

Deep Ranking Analysis by Power Eigenvectors (DRAPE): A Study. . .
271
related to the final ranking. Indeed, a regression method can be used to obtain the
standardized regression coefficients explaining the relationships between X (i.e., the
original criteria that are the independent variables) and CPWR or PWR, which is
the dependent variable (i.e., the vector “response” y). We used the ridge regression
method, which enables the calculation of the regression coefficients even in the case
of more criteria than objects and avoids spurious spikes of the coefficients. The
ridge model equation can be defined both for the single PWR rankings (at different
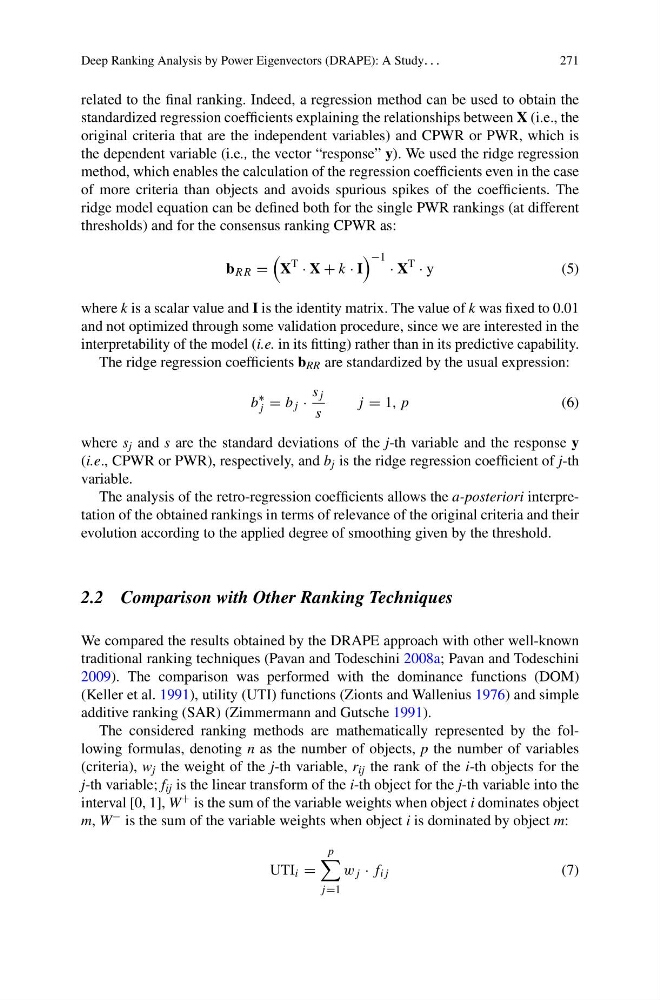
thresholds) and for the consensus ranking CPWR as:
b RR =
X
T
· X + k · I
−1 · X
T
· y
( 5 )
where k is a scalar value and I is the identity matrix. The value of k was fixed to 0.01
and not optimized through some validation procedure, since we are interested in the
interpretability of the model (i.e. in its fitting) rather than in its predictive capability.
The ridge regression coefficients b RR are standardized by the usual expression:
b
∗
j = b j ·
s j
s
j = 1, p
(6)
where s j and s are the standard deviations of the j-th variable and the response y
(i.e., CPWR or PWR), respectively, and b j is the ridge regression coefficient of j-th
variable.
The analysis of the retro-regression coefficients allows the a-posteriori interpretation of the obtained rankings in terms of relevance of the original criteria and their
evolution according to the applied degree of smoothing given by the threshold.
2.2 Comparison with Other Ranking Techniques
We compared the results obtained by the DRAPE approach with other well-known
traditional ranking techniques (Pavan and Todeschini 2008a; Pavan and Todeschini
2009). The comparison was performed with the dominance functions (DOM)
(Keller et al. 1991), utility (UTI) functions (Zionts and Wallenius 1976) and simple
additive ranking (SAR) (Zimmermann and Gutsche 1991).
The considered ranking methods are mathematically represented by the following formulas, denoting n as the number of objects, p the number of variables
(criteria), w j the weight of the j-th variable, r ij the rank of the i-th objects for the
j-th variable; f ij is the linear transform of the i-th object for the j-th variable into the
interval [0, 1], W + is the sum of the variable weights when object i dominates object
m, W − is the sum of the variable weights when object i is dominated by object m:
UTI i =
p
j =1
w j · f ij
(7)
271
related to the final ranking. Indeed, a regression method can be used to obtain the
standardized regression coefficients explaining the relationships between X (i.e., the
original criteria that are the independent variables) and CPWR or PWR, which is
the dependent variable (i.e., the vector “response” y). We used the ridge regression
method, which enables the calculation of the regression coefficients even in the case
of more criteria than objects and avoids spurious spikes of the coefficients. The
ridge model equation can be defined both for the single PWR rankings (at different
thresholds) and for the consensus ranking CPWR as:
b RR =
X
T
· X + k · I
−1 · X
T
· y
( 5 )
where k is a scalar value and I is the identity matrix. The value of k was fixed to 0.01
and not optimized through some validation procedure, since we are interested in the
interpretability of the model (i.e. in its fitting) rather than in its predictive capability.
The ridge regression coefficients b RR are standardized by the usual expression:
b
∗
j = b j ·
s j
s
j = 1, p
(6)
where s j and s are the standard deviations of the j-th variable and the response y
(i.e., CPWR or PWR), respectively, and b j is the ridge regression coefficient of j-th
variable.
The analysis of the retro-regression coefficients allows the a-posteriori interpretation of the obtained rankings in terms of relevance of the original criteria and their
evolution according to the applied degree of smoothing given by the threshold.
2.2 Comparison with Other Ranking Techniques
We compared the results obtained by the DRAPE approach with other well-known
traditional ranking techniques (Pavan and Todeschini 2008a; Pavan and Todeschini
2009). The comparison was performed with the dominance functions (DOM)
(Keller et al. 1991), utility (UTI) functions (Zionts and Wallenius 1976) and simple
additive ranking (SAR) (Zimmermann and Gutsche 1991).
The considered ranking methods are mathematically represented by the following formulas, denoting n as the number of objects, p the number of variables
(criteria), w j the weight of the j-th variable, r ij the rank of the i-th objects for the
j-th variable; f ij is the linear transform of the i-th object for the j-th variable into the
interval [0, 1], W + is the sum of the variable weights when object i dominates object
m, W − is the sum of the variable weights when object i is dominated by object m:
UTI i =
p
j =1
w j · f ij
(7)