

Deep Ranking Analysis by Power Eigenvectors (DRAPE): A Study. . .
269
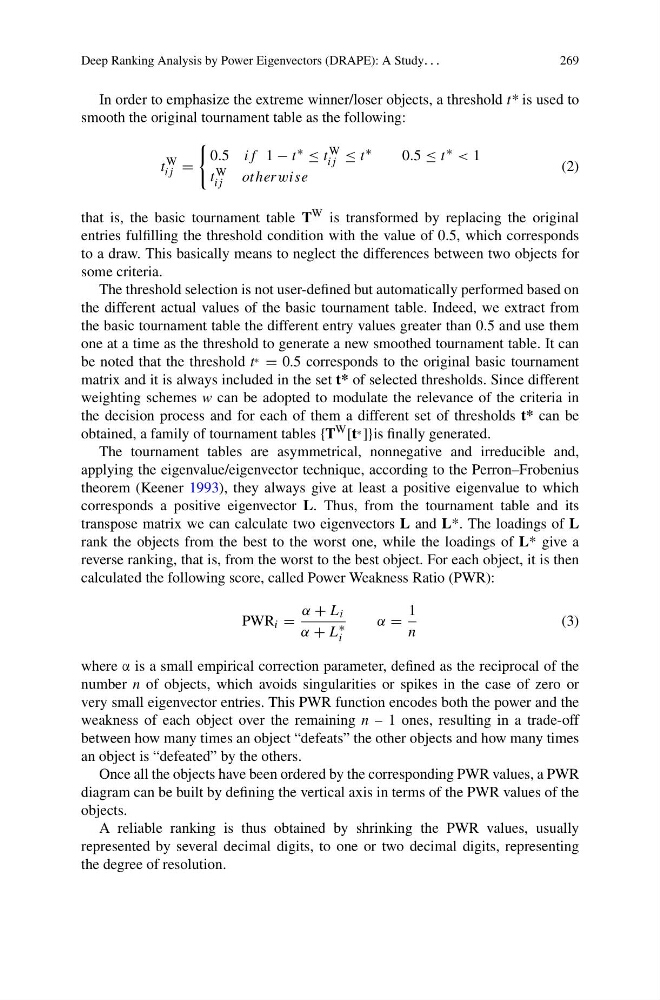
In order to emphasize the extreme winner/loser objects, a threshold t* is used to
smooth the original tournament table as the following:
t
W
ij =
0.5 if 1 − t ∗ ≤ t W
ij ≤ t ∗
0.5 ≤ t ∗ < 1
t W
ij
otherwise
(2)
that is, the basic tournament table T W is transformed by replacing the original
entries fulfilling the threshold condition with the value of 0.5, which corresponds
to a draw. This basically means to neglect the differences between two objects for
some criteria.
The threshold selection is not user-defined but automatically performed based on
the different actual values of the basic tournament table. Indeed, we extract from
the basic tournament table the different entry values greater than 0.5 and use them
one at a time as the threshold to generate a new smoothed tournament table. It can
be noted that the threshold t ∗ = 0.5 corresponds to the original basic tournament
matrix and it is always included in the set t* of selected thresholds. Since different
weighting schemes w can be adopted to modulate the relevance of the criteria in
the decision process and for each of them a different set of thresholds t* can be
obtained, a family of tournament tables {T W [t ∗ ]}is finally generated.
The tournament tables are asymmetrical, nonnegative and irreducible and,
applying the eigenvalue/eigenvector technique, according to the Perron–Frobenius
theorem (Keener 1993), they always give at least a positive eigenvalue to which
corresponds a positive eigenvector L. Thus, from the tournament table and its
transpose matrix we can calculate two eigenvectors L and L*. The loadings of L
rank the objects from the best to the worst one, while the loadings of L* give a
reverse ranking, that is, from the worst to the best object. For each object, it is then
calculated the following score, called Power Weakness Ratio (PWR):
PWR i =
α + L i
α + L ∗
i
α =
1
n
(3)
where α is a small empirical correction parameter, defined as the reciprocal of the
number n of objects, which avoids singularities or spikes in the case of zero or
very small eigenvector entries. This PWR function encodes both the power and the
weakness of each object over the remaining n – 1 ones, resulting in a trade-off
between how many times an object “defeats” the other objects and how many times
an object is “defeated” by the others.
Once all the objects have been ordered by the corresponding PWR values, a PWR
diagram can be built by defining the vertical axis in terms of the PWR values of the
objects.
A reliable ranking is thus obtained by shrinking the PWR values, usually
represented by several decimal digits, to one or two decimal digits, representing
the degree of resolution.
269
In order to emphasize the extreme winner/loser objects, a threshold t* is used to
smooth the original tournament table as the following:
t
W
ij =
0.5 if 1 − t ∗ ≤ t W
ij ≤ t ∗
0.5 ≤ t ∗ < 1
t W
ij
otherwise
(2)
that is, the basic tournament table T W is transformed by replacing the original
entries fulfilling the threshold condition with the value of 0.5, which corresponds
to a draw. This basically means to neglect the differences between two objects for
some criteria.
The threshold selection is not user-defined but automatically performed based on
the different actual values of the basic tournament table. Indeed, we extract from
the basic tournament table the different entry values greater than 0.5 and use them
one at a time as the threshold to generate a new smoothed tournament table. It can
be noted that the threshold t ∗ = 0.5 corresponds to the original basic tournament
matrix and it is always included in the set t* of selected thresholds. Since different
weighting schemes w can be adopted to modulate the relevance of the criteria in
the decision process and for each of them a different set of thresholds t* can be
obtained, a family of tournament tables {T W [t ∗ ]}is finally generated.
The tournament tables are asymmetrical, nonnegative and irreducible and,
applying the eigenvalue/eigenvector technique, according to the Perron–Frobenius
theorem (Keener 1993), they always give at least a positive eigenvalue to which
corresponds a positive eigenvector L. Thus, from the tournament table and its
transpose matrix we can calculate two eigenvectors L and L*. The loadings of L
rank the objects from the best to the worst one, while the loadings of L* give a
reverse ranking, that is, from the worst to the best object. For each object, it is then
calculated the following score, called Power Weakness Ratio (PWR):
PWR i =
α + L i
α + L ∗
i
α =
1
n
(3)
where α is a small empirical correction parameter, defined as the reciprocal of the
number n of objects, which avoids singularities or spikes in the case of zero or
very small eigenvector entries. This PWR function encodes both the power and the
weakness of each object over the remaining n – 1 ones, resulting in a trade-off
between how many times an object “defeats” the other objects and how many times
an object is “defeated” by the others.
Once all the objects have been ordered by the corresponding PWR values, a PWR
diagram can be built by defining the vertical axis in terms of the PWR values of the
objects.
A reliable ranking is thus obtained by shrinking the PWR values, usually
represented by several decimal digits, to one or two decimal digits, representing
the degree of resolution.