

258
L. S. Alaimo and P. Conigliaro
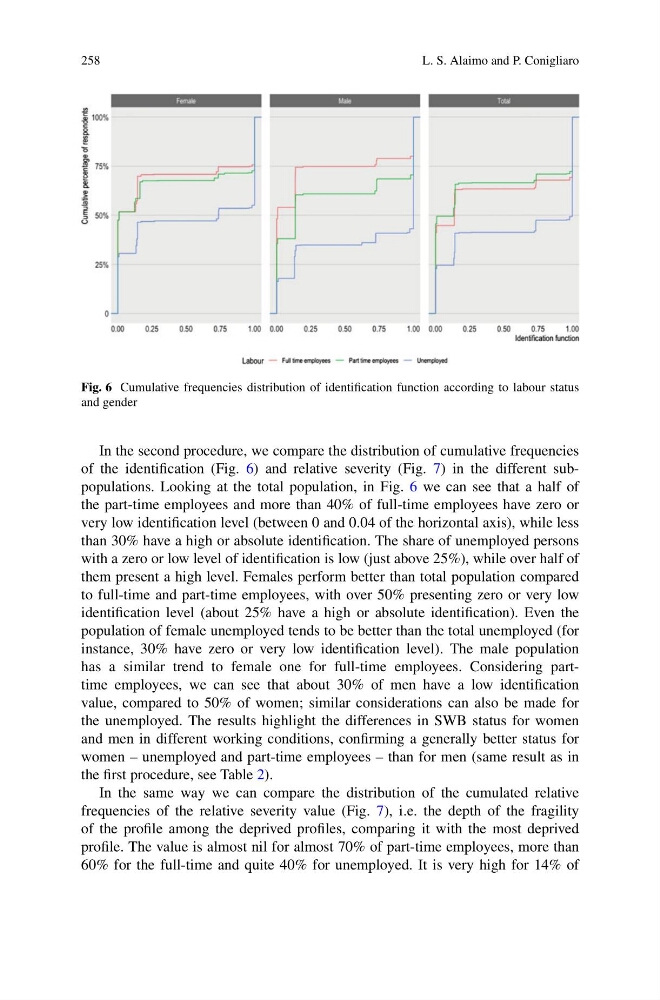
Fig. 6 Cumulative frequencies distribution of identification function according to labour status
and gender
In the second procedure, we compare the distribution of cumulative frequencies
of the identification (Fig. 6) and relative severity (Fig. 7) in the different subpopulations. Looking at the total population, in Fig. 6 we can see that a half of
the part-time employees and more than 40% of full-time employees have zero or
very low identification level (between 0 and 0.04 of the horizontal axis), while less
than 30% have a high or absolute identification. The share of unemployed persons
with a zero or low level of identification is low (just above 25%), while over half of
them present a high level. Females perform better than total population compared
to full-time and part-time employees, with over 50% presenting zero or very low
identification level (about 25% have a high or absolute identification). Even the
population of female unemployed tends to be better than the total unemployed (for
instance, 30% have zero or very low identification level). The male population
has a similar trend to female one for full-time employees. Considering parttime employees, we can see that about 30% of men have a low identification
value, compared to 50% of women; similar considerations can also be made for
the unemployed. The results highlight the differences in SWB status for women
and men in different working conditions, confirming a generally better status for
women – unemployed and part-time employees – than for men (same result as in
the first procedure, see Table 2).
In the same way we can compare the distribution of the cumulated relative
frequencies of the relative severity value (Fig. 7), i.e. the depth of the fragility
of the profile among the deprived profiles, comparing it with the most deprived
profile. The value is almost nil for almost 70% of part-time employees, more than
60% for the full-time and quite 40% for unemployed. It is very high for 14% of
L. S. Alaimo and P. Conigliaro
Fig. 6 Cumulative frequencies distribution of identification function according to labour status
and gender
In the second procedure, we compare the distribution of cumulative frequencies
of the identification (Fig. 6) and relative severity (Fig. 7) in the different subpopulations. Looking at the total population, in Fig. 6 we can see that a half of
the part-time employees and more than 40% of full-time employees have zero or
very low identification level (between 0 and 0.04 of the horizontal axis), while less
than 30% have a high or absolute identification. The share of unemployed persons
with a zero or low level of identification is low (just above 25%), while over half of
them present a high level. Females perform better than total population compared
to full-time and part-time employees, with over 50% presenting zero or very low
identification level (about 25% have a high or absolute identification). Even the
population of female unemployed tends to be better than the total unemployed (for
instance, 30% have zero or very low identification level). The male population
has a similar trend to female one for full-time employees. Considering parttime employees, we can see that about 30% of men have a low identification
value, compared to 50% of women; similar considerations can also be made for
the unemployed. The results highlight the differences in SWB status for women
and men in different working conditions, confirming a generally better status for
women – unemployed and part-time employees – than for men (same result as in
the first procedure, see Table 2).
In the same way we can compare the distribution of the cumulated relative
frequencies of the relative severity value (Fig. 7), i.e. the depth of the fragility
of the profile among the deprived profiles, comparing it with the most deprived
profile. The value is almost nil for almost 70% of part-time employees, more than
60% for the full-time and quite 40% for unemployed. It is very high for 14% of