

Assessing Subjective Well-being in Wide Populations. A Posetic Approach. . .
257
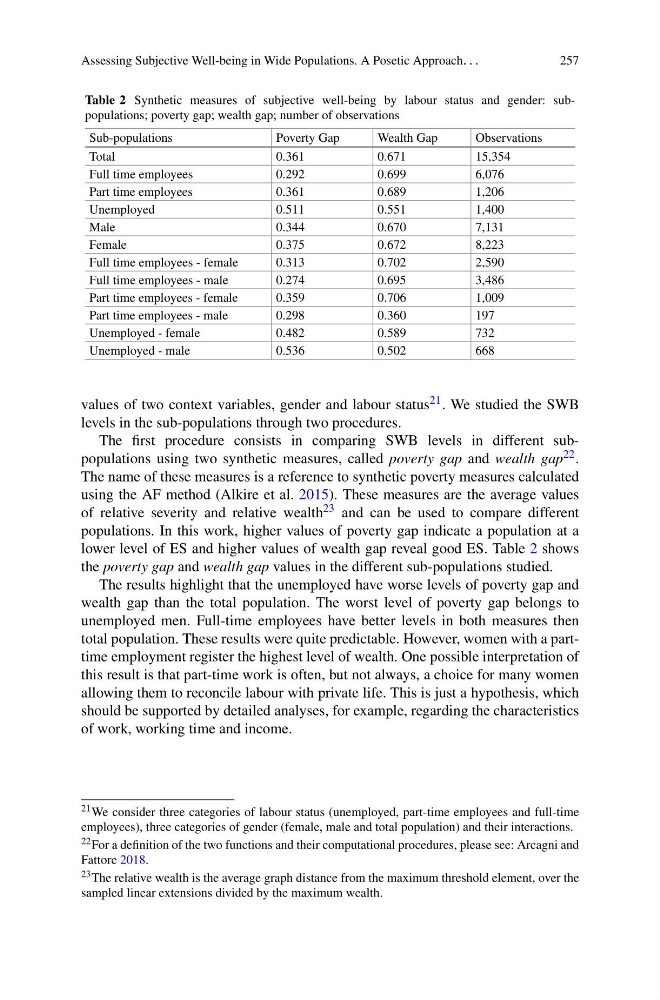
Table 2 Synthetic measures of subjective well-being by labour status and gender: subpopulations; poverty gap; wealth gap; number of observations
Sub-populations
Poverty Gap
Wealth Gap
Observations
Total
0.361
0.671
15,354
Full time employees
0.292
0.699
6,076
Part time employees
0.361
0.689
1,206
Unemployed
0.511
0.551
1,400
Male
0.344
0.670
7,131
Female
0.375
0.672
8,223
Full time employees - female
0.313
0.702
2,590
Full time employees - male
0.274
0.695
3,486
Part time employees - female
0.359
0.706
1,009
Part time employees - male
0.298
0.360
197
Unemployed - female
0.482
0.589
732
Unemployed - male
0.536
0.502
668
values of two context variables, gender and labour status 21 . We studied the SWB
levels in the sub-populations through two procedures.
The first procedure consists in comparing SWB levels in different subpopulations using two synthetic measures, called poverty gap and wealth gap 22 .
The name of these measures is a reference to synthetic poverty measures calculated
using the AF method (Alkire et al. 2015). These measures are the average values
of relative severity and relative wealth 23 and can be used to compare different
populations. In this work, higher values of poverty gap indicate a population at a
lower level of ES and higher values of wealth gap reveal good ES. Table 2 shows
the poverty gap and wealth gap values in the different sub-populations studied.
The results highlight that the unemployed have worse levels of poverty gap and
wealth gap than the total population. The worst level of poverty gap belongs to
unemployed men. Full-time employees have better levels in both measures then
total population. These results were quite predictable. However, women with a parttime employment register the highest level of wealth. One possible interpretation of
this result is that part-time work is often, but not always, a choice for many women
allowing them to reconcile labour with private life. This is just a hypothesis, which
should be supported by detailed analyses, for example, regarding the characteristics
of work, working time and income.
21 We consider three categories of labour status (unemployed, part-time employees and full-time
employees), three categories of gender (female, male and total population) and their interactions.
22 For a definition of the two functions and their computational procedures, please see: Arcagni and
Fattore 2018.
23 The relative wealth is the average graph distance from the maximum threshold element, over the
sampled linear extensions divided by the maximum wealth.
257
Table 2 Synthetic measures of subjective well-being by labour status and gender: subpopulations; poverty gap; wealth gap; number of observations
Sub-populations
Poverty Gap
Wealth Gap
Observations
Total
0.361
0.671
15,354
Full time employees
0.292
0.699
6,076
Part time employees
0.361
0.689
1,206
Unemployed
0.511
0.551
1,400
Male
0.344
0.670
7,131
Female
0.375
0.672
8,223
Full time employees - female
0.313
0.702
2,590
Full time employees - male
0.274
0.695
3,486
Part time employees - female
0.359
0.706
1,009
Part time employees - male
0.298
0.360
197
Unemployed - female
0.482
0.589
732
Unemployed - male
0.536
0.502
668
values of two context variables, gender and labour status 21 . We studied the SWB
levels in the sub-populations through two procedures.
The first procedure consists in comparing SWB levels in different subpopulations using two synthetic measures, called poverty gap and wealth gap 22 .
The name of these measures is a reference to synthetic poverty measures calculated
using the AF method (Alkire et al. 2015). These measures are the average values
of relative severity and relative wealth 23 and can be used to compare different
populations. In this work, higher values of poverty gap indicate a population at a
lower level of ES and higher values of wealth gap reveal good ES. Table 2 shows
the poverty gap and wealth gap values in the different sub-populations studied.
The results highlight that the unemployed have worse levels of poverty gap and
wealth gap than the total population. The worst level of poverty gap belongs to
unemployed men. Full-time employees have better levels in both measures then
total population. These results were quite predictable. However, women with a parttime employment register the highest level of wealth. One possible interpretation of
this result is that part-time work is often, but not always, a choice for many women
allowing them to reconcile labour with private life. This is just a hypothesis, which
should be supported by detailed analyses, for example, regarding the characteristics
of work, working time and income.
21 We consider three categories of labour status (unemployed, part-time employees and full-time
employees), three categories of gender (female, male and total population) and their interactions.
22 For a definition of the two functions and their computational procedures, please see: Arcagni and
Fattore 2018.
23 The relative wealth is the average graph distance from the maximum threshold element, over the
sampled linear extensions divided by the maximum wealth.