

Assessing Subjective Well-being in Wide Populations. A Posetic Approach. . .
255
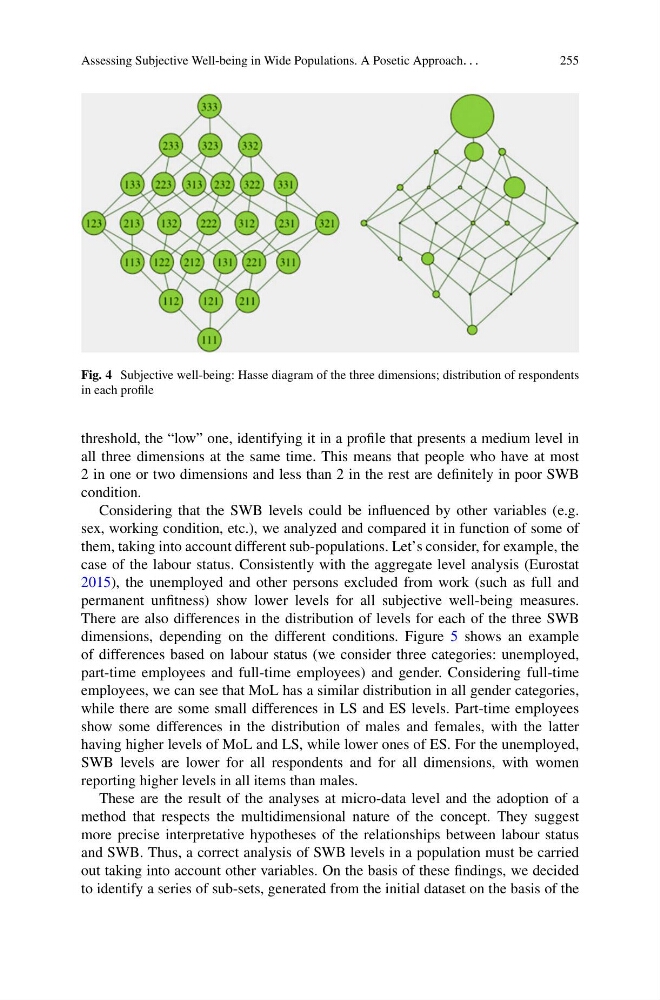
Fig. 4 Subjective well-being: Hasse diagram of the three dimensions; distribution of respondents
in each profile
threshold, the “low” one, identifying it in a profile that presents a medium level in
all three dimensions at the same time. This means that people who have at most
2 in one or two dimensions and less than 2 in the rest are definitely in poor SWB
condition.
Considering that the SWB levels could be influenced by other variables (e.g.
sex, working condition, etc.), we analyzed and compared it in function of some of
them, taking into account different sub-populations. Let’s consider, for example, the
case of the labour status. Consistently with the aggregate level analysis (Eurostat
2015), the unemployed and other persons excluded from work (such as full and
permanent unfitness) show lower levels for all subjective well-being measures.
There are also differences in the distribution of levels for each of the three SWB
dimensions, depending on the different conditions. Figure 5 shows an example
of differences based on labour status (we consider three categories: unemployed,
part-time employees and full-time employees) and gender. Considering full-time
employees, we can see that MoL has a similar distribution in all gender categories,
while there are some small differences in LS and ES levels. Part-time employees
show some differences in the distribution of males and females, with the latter
having higher levels of MoL and LS, while lower ones of ES. For the unemployed,
SWB levels are lower for all respondents and for all dimensions, with women
reporting higher levels in all items than males.
These are the result of the analyses at micro-data level and the adoption of a
method that respects the multidimensional nature of the concept. They suggest
more precise interpretative hypotheses of the relationships between labour status
and SWB. Thus, a correct analysis of SWB levels in a population must be carried
out taking into account other variables. On the basis of these findings, we decided
to identify a series of sub-sets, generated from the initial dataset on the basis of the
255
Fig. 4 Subjective well-being: Hasse diagram of the three dimensions; distribution of respondents
in each profile
threshold, the “low” one, identifying it in a profile that presents a medium level in
all three dimensions at the same time. This means that people who have at most
2 in one or two dimensions and less than 2 in the rest are definitely in poor SWB
condition.
Considering that the SWB levels could be influenced by other variables (e.g.
sex, working condition, etc.), we analyzed and compared it in function of some of
them, taking into account different sub-populations. Let’s consider, for example, the
case of the labour status. Consistently with the aggregate level analysis (Eurostat
2015), the unemployed and other persons excluded from work (such as full and
permanent unfitness) show lower levels for all subjective well-being measures.
There are also differences in the distribution of levels for each of the three SWB
dimensions, depending on the different conditions. Figure 5 shows an example
of differences based on labour status (we consider three categories: unemployed,
part-time employees and full-time employees) and gender. Considering full-time
employees, we can see that MoL has a similar distribution in all gender categories,
while there are some small differences in LS and ES levels. Part-time employees
show some differences in the distribution of males and females, with the latter
having higher levels of MoL and LS, while lower ones of ES. For the unemployed,
SWB levels are lower for all respondents and for all dimensions, with women
reporting higher levels in all items than males.
These are the result of the analyses at micro-data level and the adoption of a
method that respects the multidimensional nature of the concept. They suggest
more precise interpretative hypotheses of the relationships between labour status
and SWB. Thus, a correct analysis of SWB levels in a population must be carried
out taking into account other variables. On the basis of these findings, we decided
to identify a series of sub-sets, generated from the initial dataset on the basis of the