

254
L. S. Alaimo and P. Conigliaro
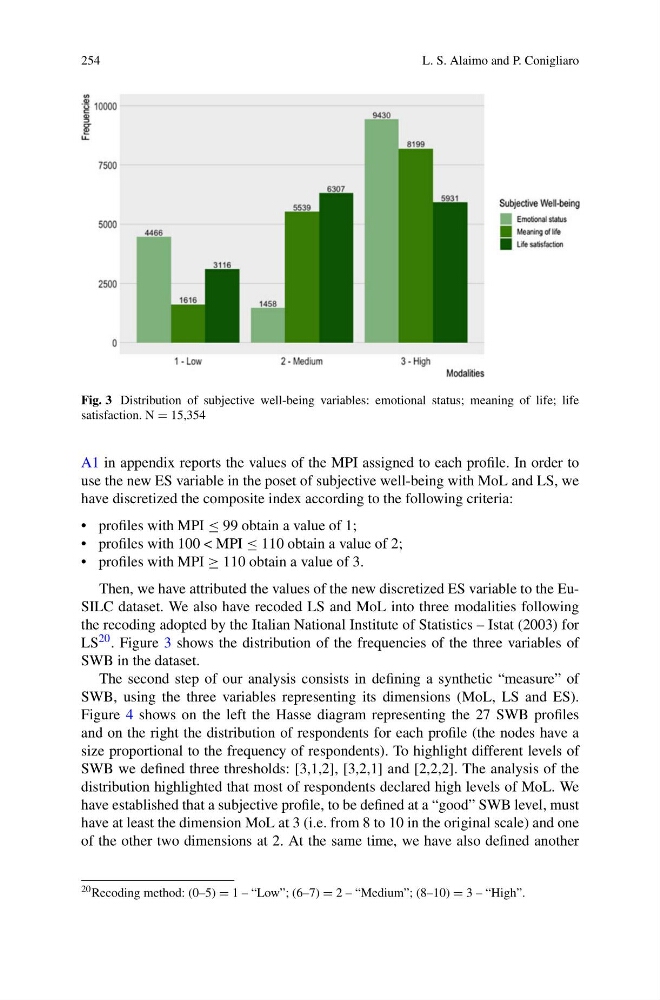
Fig. 3 Distribution of subjective well-being variables: emotional status; meaning of life; life
satisfaction. N = 15,354
A1 in appendix reports the values of the MPI assigned to each profile. In order to
use the new ES variable in the poset of subjective well-being with MoL and LS, we
have discretized the composite index according to the following criteria:
• profiles with MPI ≤ 99 obtain a value of 1;
• profiles with 100 < MPI ≤ 110 obtain a value of 2;
• profiles with MPI ≥ 110 obtain a value of 3.
Then, we have attributed the values of the new discretized ES variable to the EuSILC dataset. We also have recoded LS and MoL into three modalities following
the recoding adopted by the Italian National Institute of Statistics – Istat (2003) for
LS 20 . Figure 3 shows the distribution of the frequencies of the three variables of
SWB in the dataset.
The second step of our analysis consists in defining a synthetic “measure” of
SWB, using the three variables representing its dimensions (MoL, LS and ES).
Figure 4 shows on the left the Hasse diagram representing the 27 SWB profiles
and on the right the distribution of respondents for each profile (the nodes have a
size proportional to the frequency of respondents). To highlight different levels of
SWB we defined three thresholds: [3,1,2], [3,2,1] and [2,2,2]. The analysis of the
distribution highlighted that most of respondents declared high levels of MoL. We
have established that a subjective profile, to be defined at a “good” SWB level, must
have at least the dimension MoL at 3 (i.e. from 8 to 10 in the original scale) and one
of the other two dimensions at 2. At the same time, we have also defined another
20 Recoding method: (0–5) = 1 – “Low”; (6–7) = 2 – “Medium”; (8–10) = 3 – “High”.
L. S. Alaimo and P. Conigliaro
Fig. 3 Distribution of subjective well-being variables: emotional status; meaning of life; life
satisfaction. N = 15,354
A1 in appendix reports the values of the MPI assigned to each profile. In order to
use the new ES variable in the poset of subjective well-being with MoL and LS, we
have discretized the composite index according to the following criteria:
• profiles with MPI ≤ 99 obtain a value of 1;
• profiles with 100 < MPI ≤ 110 obtain a value of 2;
• profiles with MPI ≥ 110 obtain a value of 3.
Then, we have attributed the values of the new discretized ES variable to the EuSILC dataset. We also have recoded LS and MoL into three modalities following
the recoding adopted by the Italian National Institute of Statistics – Istat (2003) for
LS 20 . Figure 3 shows the distribution of the frequencies of the three variables of
SWB in the dataset.
The second step of our analysis consists in defining a synthetic “measure” of
SWB, using the three variables representing its dimensions (MoL, LS and ES).
Figure 4 shows on the left the Hasse diagram representing the 27 SWB profiles
and on the right the distribution of respondents for each profile (the nodes have a
size proportional to the frequency of respondents). To highlight different levels of
SWB we defined three thresholds: [3,1,2], [3,2,1] and [2,2,2]. The analysis of the
distribution highlighted that most of respondents declared high levels of MoL. We
have established that a subjective profile, to be defined at a “good” SWB level, must
have at least the dimension MoL at 3 (i.e. from 8 to 10 in the original scale) and one
of the other two dimensions at 2. At the same time, we have also defined another
20 Recoding method: (0–5) = 1 – “Low”; (6–7) = 2 – “Medium”; (8–10) = 3 – “High”.