

There Is No Such Thing as a Free Lunch! Who Is Paying for Our Happiness?
215
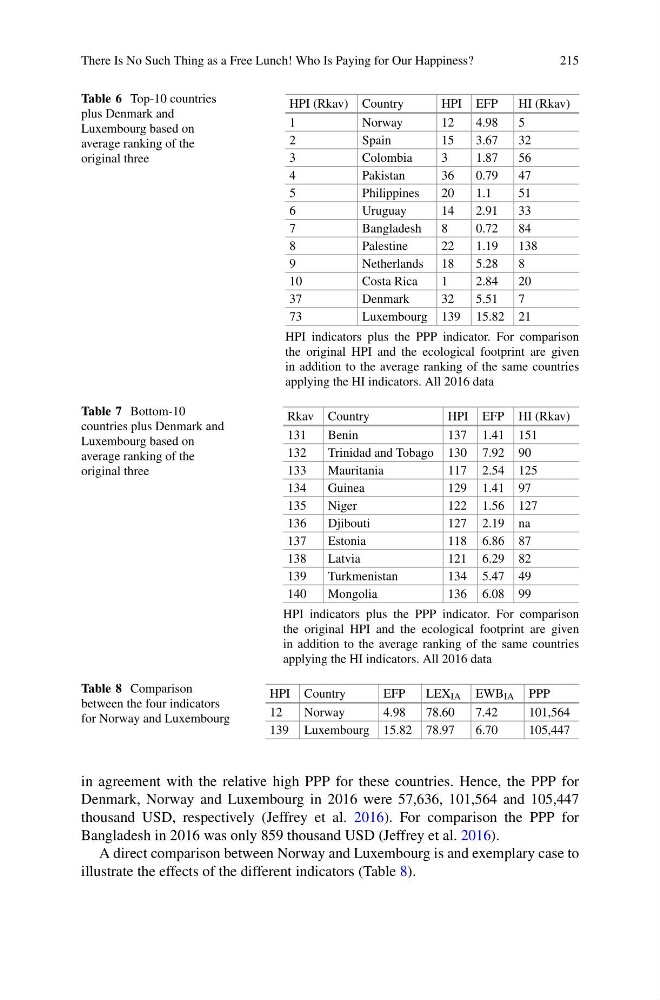
Table 6 Top-10 countries
plus Denmark and
Luxembourg based on
average ranking of the
original three
HPI (Rkav) Country
HPI EFP
HI (Rkav)
1
Norway
12
4.98
5
2
Spain
15
3.67
32
3
Colombia
3
1.87
56
4
Pakistan
36
0.79
47
5
Philippines
20
1.1
51
6
Uruguay
14
2.91
33
7
Bangladesh
8
0.72
84
8
Palestine
22
1.19
138
9
Netherlands 18
5.28
8
10
Costa Rica
1
2.84
20
37
Denmark
32
5.51
7
73
Luxembourg 139 15.82 21
HPI indicators plus the PPP indicator. For comparison
the original HPI and the ecological footprint are given
in addition to the average ranking of the same countries
applying the HI indicators. All 2016 data
Table 7 Bottom-10
countries plus Denmark and
Luxembourg based on
average ranking of the
original three
Rkav Country
HPI EFP HI (Rkav)
131
Benin
137 1.41 151
132
Trinidad and Tobago 130 7.92 90
133
Mauritania
117 2.54 125
134
Guinea
129 1.41 97
135
Niger
122 1.56 127
136
Djibouti
127 2.19 na
137
Estonia
118 6.86 87
138
Latvia
121 6.29 82
139
Turkmenistan
134 5.47 49
140
Mongolia
136 6.08 99
HPI indicators plus the PPP indicator. For comparison
the original HPI and the ecological footprint are given
in addition to the average ranking of the same countries
applying the HI indicators. All 2016 data
Table 8 Comparison
between the four indicators
for Norway and Luxembourg
HPI Country
EFP
LEX IA EWB IA PPP
12
Norway
4.98
78.60
7.42
101,564
139 Luxembourg 15.82 78.97
6.70
105,447
in agreement with the relative high PPP for these countries. Hence, the PPP for
Denmark, Norway and Luxembourg in 2016 were 57,636, 101,564 and 105,447
thousand USD, respectively (Jeffrey et al. 2016). For comparison the PPP for
Bangladesh in 2016 was only 859 thousand USD (Jeffrey et al. 2016).
A direct comparison between Norway and Luxembourg is and exemplary case to
illustrate the effects of the different indicators (Table 8).
215
Table 6 Top-10 countries
plus Denmark and
Luxembourg based on
average ranking of the
original three
HPI (Rkav) Country
HPI EFP
HI (Rkav)
1
Norway
12
4.98
5
2
Spain
15
3.67
32
3
Colombia
3
1.87
56
4
Pakistan
36
0.79
47
5
Philippines
20
1.1
51
6
Uruguay
14
2.91
33
7
Bangladesh
8
0.72
84
8
Palestine
22
1.19
138
9
Netherlands 18
5.28
8
10
Costa Rica
1
2.84
20
37
Denmark
32
5.51
7
73
Luxembourg 139 15.82 21
HPI indicators plus the PPP indicator. For comparison
the original HPI and the ecological footprint are given
in addition to the average ranking of the same countries
applying the HI indicators. All 2016 data
Table 7 Bottom-10
countries plus Denmark and
Luxembourg based on
average ranking of the
original three
Rkav Country
HPI EFP HI (Rkav)
131
Benin
137 1.41 151
132
Trinidad and Tobago 130 7.92 90
133
Mauritania
117 2.54 125
134
Guinea
129 1.41 97
135
Niger
122 1.56 127
136
Djibouti
127 2.19 na
137
Estonia
118 6.86 87
138
Latvia
121 6.29 82
139
Turkmenistan
134 5.47 49
140
Mongolia
136 6.08 99
HPI indicators plus the PPP indicator. For comparison
the original HPI and the ecological footprint are given
in addition to the average ranking of the same countries
applying the HI indicators. All 2016 data
Table 8 Comparison
between the four indicators
for Norway and Luxembourg
HPI Country
EFP
LEX IA EWB IA PPP
12
Norway
4.98
78.60
7.42
101,564
139 Luxembourg 15.82 78.97
6.70
105,447
in agreement with the relative high PPP for these countries. Hence, the PPP for
Denmark, Norway and Luxembourg in 2016 were 57,636, 101,564 and 105,447
thousand USD, respectively (Jeffrey et al. 2016). For comparison the PPP for
Bangladesh in 2016 was only 859 thousand USD (Jeffrey et al. 2016).
A direct comparison between Norway and Luxembourg is and exemplary case to
illustrate the effects of the different indicators (Table 8).