

214
L. Carlsen
Table 5 Bottom-10
countries based on average
ranking of the HPI indicators
Rkav Country
HPI EFP HI (Rkav)
131
Gabon
120 2.02 153
132
Trinidad and Tobago 130 7.92 90
133
Benin
137 1.41 151
134
Estonia
118 6.86 87
135
South Africa
128 3.31 136
136
Djibouti
127 2.19 na
137
Latvia
121 6.29 82
138
Botswana
126 3.83 130
139
Turkmenistan
134 5.47 49
140
Mongolia
136 6.08 99
For comparison the original HPI and the ecological footprint are given in addition to the average ranking of the
same countries applying the HI indicators. All 2016 data
Fig. 3 Relative importance
of the three original
indicators used to generate
the 2016 Happy Planet Index
plus the Purchasing Power
Parity (Jeffrey et al. 2016)
EFP
1.24
2.48
3.72
4.96
6.2
10^3
LEX
WB
PPP
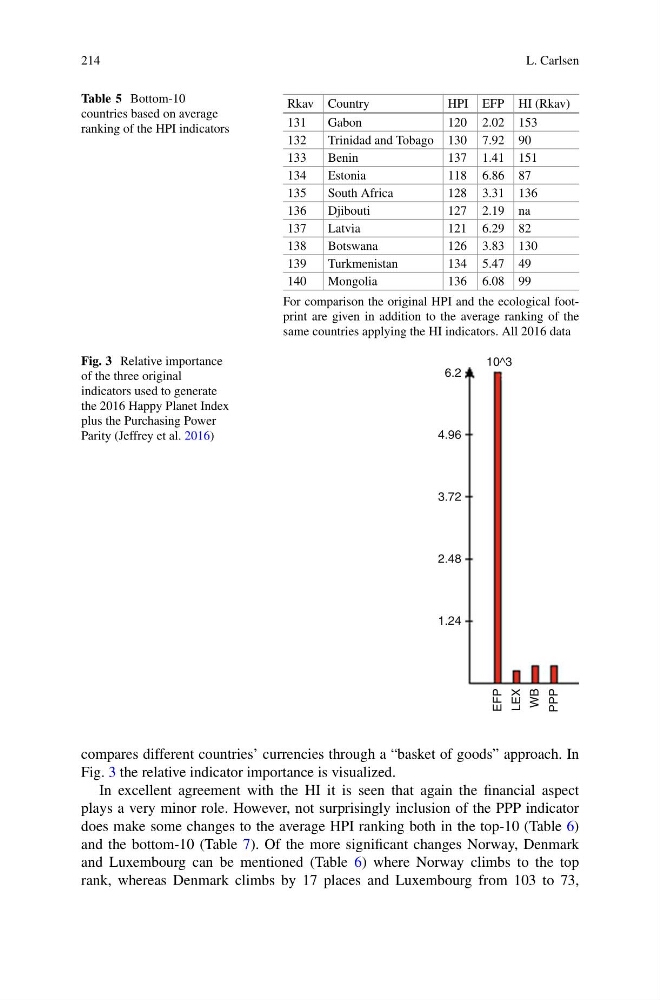
compares different countries’ currencies through a “basket of goods” approach. In
Fig. 3 the relative indicator importance is visualized.
In excellent agreement with the HI it is seen that again the financial aspect
plays a very minor role. However, not surprisingly inclusion of the PPP indicator
does make some changes to the average HPI ranking both in the top-10 (Table 6)
and the bottom-10 (Table 7). Of the more significant changes Norway, Denmark
and Luxembourg can be mentioned (Table 6) where Norway climbs to the top
rank, whereas Denmark climbs by 17 places and Luxembourg from 103 to 73,
L. Carlsen
Table 5 Bottom-10
countries based on average
ranking of the HPI indicators
Rkav Country
HPI EFP HI (Rkav)
131
Gabon
120 2.02 153
132
Trinidad and Tobago 130 7.92 90
133
Benin
137 1.41 151
134
Estonia
118 6.86 87
135
South Africa
128 3.31 136
136
Djibouti
127 2.19 na
137
Latvia
121 6.29 82
138
Botswana
126 3.83 130
139
Turkmenistan
134 5.47 49
140
Mongolia
136 6.08 99
For comparison the original HPI and the ecological footprint are given in addition to the average ranking of the
same countries applying the HI indicators. All 2016 data
Fig. 3 Relative importance
of the three original
indicators used to generate
the 2016 Happy Planet Index
plus the Purchasing Power
Parity (Jeffrey et al. 2016)
EFP
1.24
2.48
3.72
4.96
6.2
10^3
LEX
WB
PPP
compares different countries’ currencies through a “basket of goods” approach. In
Fig. 3 the relative indicator importance is visualized.
In excellent agreement with the HI it is seen that again the financial aspect
plays a very minor role. However, not surprisingly inclusion of the PPP indicator
does make some changes to the average HPI ranking both in the top-10 (Table 6)
and the bottom-10 (Table 7). Of the more significant changes Norway, Denmark
and Luxembourg can be mentioned (Table 6) where Norway climbs to the top
rank, whereas Denmark climbs by 17 places and Luxembourg from 103 to 73,