

162
L. Carlsen
to be Sn > ste > W > Pb > Bi > cer the average heights being 5.5, 4.3, 4.0, 3.5, 2.0 and
1.7, respectively, whereas excluding the Cost indicator we find Sn > W > ste > Bi >
cer > Pb, the average height being 6.0, 4.7, 3.9, 3.1, 1.8 and 1.6, respectively, i.e.,
the ranking being identical for the conservative and non-conservative approach.
3.4 How Sure Are We on the Ranking?
Looking at the rankings in cases where the Cost indicator is excluded it is clear
that Sn turns out as the optimal alternative to Pb split-shots, since Sn is ranked as
high as possible (average height = 6.0) as the only maximal element. However,
with inclusion of the Cost indicator the picture becomes somewhat more blurred.
Thus, decision makers may have a requirement to information concerning how sure
we are on the ranking of the alternatives as the ranking presented, based on partial
order methodology are average ranking, i.e., the is a finite probability that the single
alternatives may take several absolute ranks.
To fulfill such requirements partial order methodology offers several possibilities.
In the present study the Bubley-Dyer approach to average ranking (Bubley and Dyer
1999; Bruggemann and Patil 2011) is applied, by which the probabilities for the
single elements to have a specific rank are retrieved.
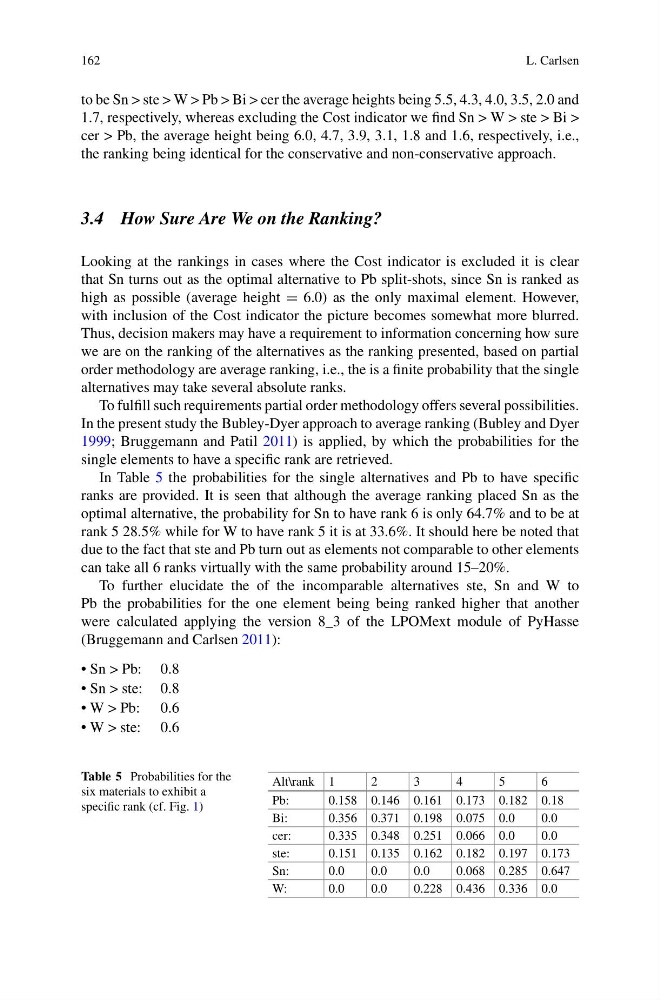
In Table 5 the probabilities for the single alternatives and Pb to have specific
ranks are provided. It is seen that although the average ranking placed Sn as the
optimal alternative, the probability for Sn to have rank 6 is only 64.7% and to be at
rank 5 28.5% while for W to have rank 5 it is at 33.6%. It should here be noted that
due to the fact that ste and Pb turn out as elements not comparable to other elements
can take all 6 ranks virtually with the same probability around 15–20%.
To further elucidate the of the incomparable alternatives ste, Sn and W to
Pb the probabilities for the one element being being ranked higher that another
were calculated applying the version 8_3 of the LPOMext module of PyHasse
(Bruggemann and Carlsen 2011):
• Sn > Pb: 0.8
• Sn > ste: 0.8
• W > Pb: 0.6
• W > ste: 0.6
Table 5 Probabilities for the
six materials to exhibit a
specific rank (cf. Fig. 1)
Alt\rank 1
2
3
4
5
6
Pb:
0.158 0.146 0.161 0.173 0.182 0.18
Bi:
0.356 0.371 0.198 0.075 0.0
0.0
cer:
0.335 0.348 0.251 0.066 0.0
0.0
ste:
0.151 0.135 0.162 0.182 0.197 0.173
Sn:
0.0
0.0
0.0
0.068 0.285 0.647
W:
0.0
0.0
0.228 0.436 0.336 0.0
L. Carlsen
to be Sn > ste > W > Pb > Bi > cer the average heights being 5.5, 4.3, 4.0, 3.5, 2.0 and
1.7, respectively, whereas excluding the Cost indicator we find Sn > W > ste > Bi >
cer > Pb, the average height being 6.0, 4.7, 3.9, 3.1, 1.8 and 1.6, respectively, i.e.,
the ranking being identical for the conservative and non-conservative approach.
3.4 How Sure Are We on the Ranking?
Looking at the rankings in cases where the Cost indicator is excluded it is clear
that Sn turns out as the optimal alternative to Pb split-shots, since Sn is ranked as
high as possible (average height = 6.0) as the only maximal element. However,
with inclusion of the Cost indicator the picture becomes somewhat more blurred.
Thus, decision makers may have a requirement to information concerning how sure
we are on the ranking of the alternatives as the ranking presented, based on partial
order methodology are average ranking, i.e., the is a finite probability that the single
alternatives may take several absolute ranks.
To fulfill such requirements partial order methodology offers several possibilities.
In the present study the Bubley-Dyer approach to average ranking (Bubley and Dyer
1999; Bruggemann and Patil 2011) is applied, by which the probabilities for the
single elements to have a specific rank are retrieved.
In Table 5 the probabilities for the single alternatives and Pb to have specific
ranks are provided. It is seen that although the average ranking placed Sn as the
optimal alternative, the probability for Sn to have rank 6 is only 64.7% and to be at
rank 5 28.5% while for W to have rank 5 it is at 33.6%. It should here be noted that
due to the fact that ste and Pb turn out as elements not comparable to other elements
can take all 6 ranks virtually with the same probability around 15–20%.
To further elucidate the of the incomparable alternatives ste, Sn and W to
Pb the probabilities for the one element being being ranked higher that another
were calculated applying the version 8_3 of the LPOMext module of PyHasse
(Bruggemann and Carlsen 2011):
• Sn > Pb: 0.8
• Sn > ste: 0.8
• W > Pb: 0.6
• W > ste: 0.6
Table 5 Probabilities for the
six materials to exhibit a
specific rank (cf. Fig. 1)
Alt\rank 1
2
3
4
5
6
Pb:
0.158 0.146 0.161 0.173 0.182 0.18
Bi:
0.356 0.371 0.198 0.075 0.0
0.0
cer:
0.335 0.348 0.251 0.066 0.0
0.0
ste:
0.151 0.135 0.162 0.182 0.197 0.173
Sn:
0.0
0.0
0.0
0.068 0.285 0.647
W:
0.0
0.0
0.228 0.436 0.336 0.0