

160
L. Carlsen
Table 4 Aggregated data
matrix (conservative
approach)
Criteria TPCr EnCr HHCr Cost
Pb
0
0
0
0
Bi
0
1
1
−2
cer
−3
−3
3
−2
ste
−3
3
3
−1
Sn
0
3
3
−2
W
0
1
3
−2
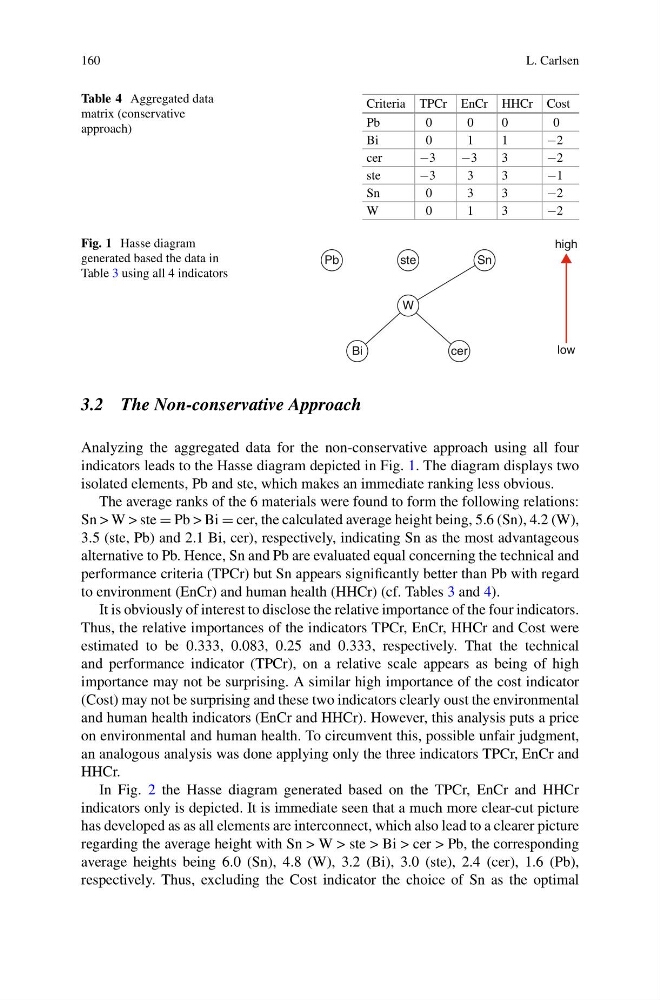
Fig. 1 Hasse diagram
generated based the data in
Table 3 using all 4 indicators
Pb
ste
Sn
W
Bi
cer
low
high
3.2 The Non-conservative Approach
Analyzing the aggregated data for the non-conservative approach using all four
indicators leads to the Hasse diagram depicted in Fig. 1. The diagram displays two
isolated elements, Pb and ste, which makes an immediate ranking less obvious.
The average ranks of the 6 materials were found to form the following relations:
Sn > W > ste = Pb > Bi = cer, the calculated average height being, 5.6 (Sn), 4.2 (W),
3.5 (ste, Pb) and 2.1 Bi, cer), respectively, indicating Sn as the most advantageous
alternative to Pb. Hence, Sn and Pb are evaluated equal concerning the technical and
performance criteria (TPCr) but Sn appears significantly better than Pb with regard
to environment (EnCr) and human health (HHCr) (cf. Tables 3 and 4).
It is obviously of interest to disclose the relative importance of the four indicators.
Thus, the relative importances of the indicators TPCr, EnCr, HHCr and Cost were
estimated to be 0.333, 0.083, 0.25 and 0.333, respectively. That the technical
and performance indicator (TPCr), on a relative scale appears as being of high
importance may not be surprising. A similar high importance of the cost indicator
(Cost) may not be surprising and these two indicators clearly oust the environmental
and human health indicators (EnCr and HHCr). However, this analysis puts a price
on environmental and human health. To circumvent this, possible unfair judgment,
an analogous analysis was done applying only the three indicators TPCr, EnCr and
HHCr.
In Fig. 2 the Hasse diagram generated based on the TPCr, EnCr and HHCr
indicators only is depicted. It is immediate seen that a much more clear-cut picture
has developed as as all elements are interconnect, which also lead to a clearer picture
regarding the average height with Sn > W > ste > Bi > cer > Pb, the corresponding
average heights being 6.0 (Sn), 4.8 (W), 3.2 (Bi), 3.0 (ste), 2.4 (cer), 1.6 (Pb),
respectively. Thus, excluding the Cost indicator the choice of Sn as the optimal
L. Carlsen
Table 4 Aggregated data
matrix (conservative
approach)
Criteria TPCr EnCr HHCr Cost
Pb
0
0
0
0
Bi
0
1
1
−2
cer
−3
−3
3
−2
ste
−3
3
3
−1
Sn
0
3
3
−2
W
0
1
3
−2
Fig. 1 Hasse diagram
generated based the data in
Table 3 using all 4 indicators
Pb
ste
Sn
W
Bi
cer
low
high
3.2 The Non-conservative Approach
Analyzing the aggregated data for the non-conservative approach using all four
indicators leads to the Hasse diagram depicted in Fig. 1. The diagram displays two
isolated elements, Pb and ste, which makes an immediate ranking less obvious.
The average ranks of the 6 materials were found to form the following relations:
Sn > W > ste = Pb > Bi = cer, the calculated average height being, 5.6 (Sn), 4.2 (W),
3.5 (ste, Pb) and 2.1 Bi, cer), respectively, indicating Sn as the most advantageous
alternative to Pb. Hence, Sn and Pb are evaluated equal concerning the technical and
performance criteria (TPCr) but Sn appears significantly better than Pb with regard
to environment (EnCr) and human health (HHCr) (cf. Tables 3 and 4).
It is obviously of interest to disclose the relative importance of the four indicators.
Thus, the relative importances of the indicators TPCr, EnCr, HHCr and Cost were
estimated to be 0.333, 0.083, 0.25 and 0.333, respectively. That the technical
and performance indicator (TPCr), on a relative scale appears as being of high
importance may not be surprising. A similar high importance of the cost indicator
(Cost) may not be surprising and these two indicators clearly oust the environmental
and human health indicators (EnCr and HHCr). However, this analysis puts a price
on environmental and human health. To circumvent this, possible unfair judgment,
an analogous analysis was done applying only the three indicators TPCr, EnCr and
HHCr.
In Fig. 2 the Hasse diagram generated based on the TPCr, EnCr and HHCr
indicators only is depicted. It is immediate seen that a much more clear-cut picture
has developed as as all elements are interconnect, which also lead to a clearer picture
regarding the average height with Sn > W > ste > Bi > cer > Pb, the corresponding
average heights being 6.0 (Sn), 4.8 (W), 3.2 (Bi), 3.0 (ste), 2.4 (cer), 1.6 (Pb),
respectively. Thus, excluding the Cost indicator the choice of Sn as the optimal