

130
G. Al-Sharrah and H. M. S. Lababidi
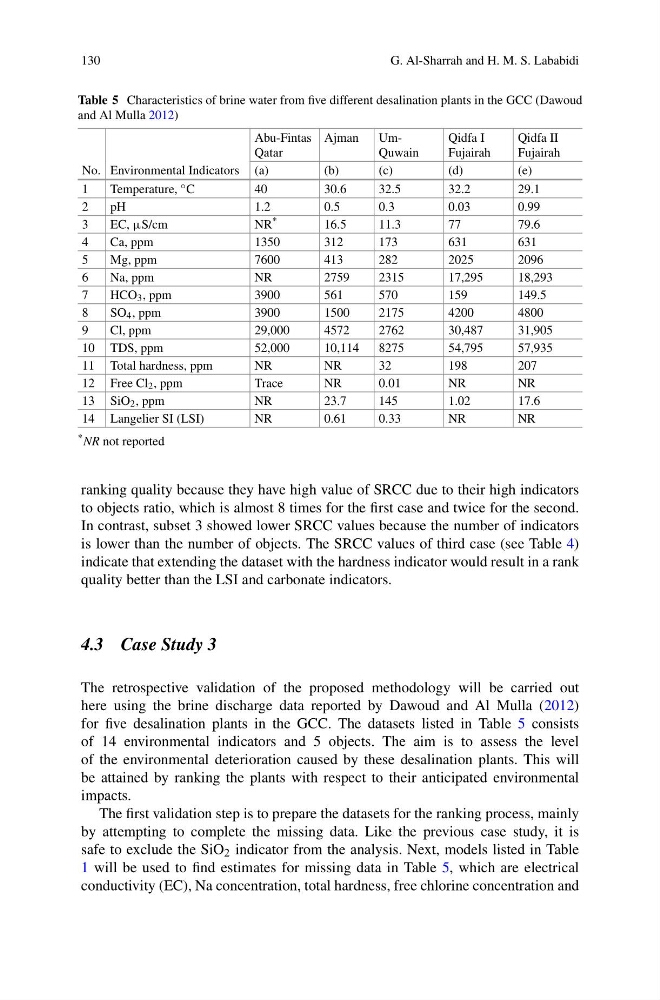
Table 5 Characteristics of brine water from five different desalination plants in the GCC (Dawoud
and Al Mulla 2012)
Abu-Fintas
Qatar
Ajman
UmQuwain
Qidfa I
Fujairah
Qidfa II
Fujairah
No. Environmental Indicators (a)
(b)
(c)
(d)
(e)
1
Temperature, ◦ C
40
30.6
32.5
32.2
29.1
2
pH
1.2
0.5
0.3
0.03
0.99
3
EC, μS/cm
NR *
16.5
11.3
77
79.6
4
Ca, ppm
1350
312
173
631
631
5
Mg, ppm
7600
413
282
2025
2096
6
Na, ppm
NR
2759
2315
17,295
18,293
7
HCO 3 , ppm
3900
561
570
159
149.5
8
SO 4 , ppm
3900
1500
2175
4200
4800
9
Cl, ppm
29,000
4572
2762
30,487
31,905
10 TDS, ppm
52,000
10,114
8275
54,795
57,935
11 Total hardness, ppm
NR
NR
32
198
207
12 Free Cl 2 , ppm
Trace
NR
0.01
NR
NR
13 SiO 2 , ppm
NR
23.7
145
1.02
17.6
14 Langelier SI (LSI)
NR
0.61
0.33
NR
NR
* NR not reported
ranking quality because they have high value of SRCC due to their high indicators
to objects ratio, which is almost 8 times for the first case and twice for the second.
In contrast, subset 3 showed lower SRCC values because the number of indicators
is lower than the number of objects. The SRCC values of third case (see Table 4)
indicate that extending the dataset with the hardness indicator would result in a rank
quality better than the LSI and carbonate indicators.
4.3 Case Study 3
The retrospective validation of the proposed methodology will be carried out
here using the brine discharge data reported by Dawoud and Al Mulla (2012)
for five desalination plants in the GCC. The datasets listed in Table 5 consists
of 14 environmental indicators and 5 objects. The aim is to assess the level
of the environmental deterioration caused by these desalination plants. This will
be attained by ranking the plants with respect to their anticipated environmental
impacts.
The first validation step is to prepare the datasets for the ranking process, mainly
by attempting to complete the missing data. Like the previous case study, it is
safe to exclude the SiO 2 indicator from the analysis. Next, models listed in Table
1 will be used to find estimates for missing data in Table 5, which are electrical
conductivity (EC), Na concentration, total hardness, free chlorine concentration and
G. Al-Sharrah and H. M. S. Lababidi
Table 5 Characteristics of brine water from five different desalination plants in the GCC (Dawoud
and Al Mulla 2012)
Abu-Fintas
Qatar
Ajman
UmQuwain
Qidfa I
Fujairah
Qidfa II
Fujairah
No. Environmental Indicators (a)
(b)
(c)
(d)
(e)
1
Temperature, ◦ C
40
30.6
32.5
32.2
29.1
2
pH
1.2
0.5
0.3
0.03
0.99
3
EC, μS/cm
NR *
16.5
11.3
77
79.6
4
Ca, ppm
1350
312
173
631
631
5
Mg, ppm
7600
413
282
2025
2096
6
Na, ppm
NR
2759
2315
17,295
18,293
7
HCO 3 , ppm
3900
561
570
159
149.5
8
SO 4 , ppm
3900
1500
2175
4200
4800
9
Cl, ppm
29,000
4572
2762
30,487
31,905
10 TDS, ppm
52,000
10,114
8275
54,795
57,935
11 Total hardness, ppm
NR
NR
32
198
207
12 Free Cl 2 , ppm
Trace
NR
0.01
NR
NR
13 SiO 2 , ppm
NR
23.7
145
1.02
17.6
14 Langelier SI (LSI)
NR
0.61
0.33
NR
NR
* NR not reported
ranking quality because they have high value of SRCC due to their high indicators
to objects ratio, which is almost 8 times for the first case and twice for the second.
In contrast, subset 3 showed lower SRCC values because the number of indicators
is lower than the number of objects. The SRCC values of third case (see Table 4)
indicate that extending the dataset with the hardness indicator would result in a rank
quality better than the LSI and carbonate indicators.
4.3 Case Study 3
The retrospective validation of the proposed methodology will be carried out
here using the brine discharge data reported by Dawoud and Al Mulla (2012)
for five desalination plants in the GCC. The datasets listed in Table 5 consists
of 14 environmental indicators and 5 objects. The aim is to assess the level
of the environmental deterioration caused by these desalination plants. This will
be attained by ranking the plants with respect to their anticipated environmental
impacts.
The first validation step is to prepare the datasets for the ranking process, mainly
by attempting to complete the missing data. Like the previous case study, it is
safe to exclude the SiO 2 indicator from the analysis. Next, models listed in Table
1 will be used to find estimates for missing data in Table 5, which are electrical
conductivity (EC), Na concentration, total hardness, free chlorine concentration and