

Dependent Indicators for Environmental Evaluations of Desalination Plants
129
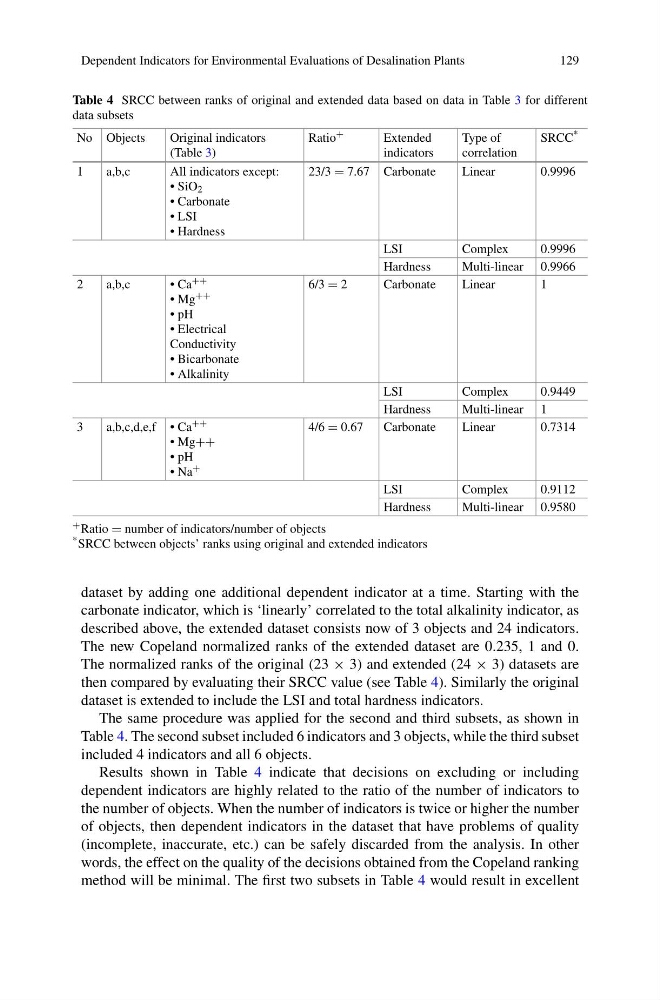
Table 4 SRCC between ranks of original and extended data based on data in Table 3 for different
data subsets
No Objects
Original indicators
(Table 3)
Ratio +
Extended
indicators
Type of
correlation
SRCC *
1
a,b,c
All indicators except:
• SiO 2
• Carbonate
• LSI
• Hardness
23/3 = 7.67 Carbonate
Linear
0.9996
LSI
Complex
0.9996
Hardness
Multi-linear 0.9966
2
a,b,c
• Ca ++
• Mg ++
• pH
• Electrical
Conductivity
• Bicarbonate
• Alkalinity
6/3 = 2
Carbonate
Linear
1
LSI
Complex
0.9449
Hardness
Multi-linear 1
3
a,b,c,d,e,f • Ca ++
• Mg++
• pH
• Na +
4/6 = 0.67
Carbonate
Linear
0.7314
LSI
Complex
0.9112
Hardness
Multi-linear 0.9580
+ Ratio = number of indicators/number of objects
* SRCC between objects’ ranks using original and extended indicators
dataset by adding one additional dependent indicator at a time. Starting with the
carbonate indicator, which is ‘linearly’ correlated to the total alkalinity indicator, as
described above, the extended dataset consists now of 3 objects and 24 indicators.
The new Copeland normalized ranks of the extended dataset are 0.235, 1 and 0.
The normalized ranks of the original (23 × 3) and extended (24 × 3) datasets are
then compared by evaluating their SRCC value (see Table 4). Similarly the original
dataset is extended to include the LSI and total hardness indicators.
The same procedure was applied for the second and third subsets, as shown in
Table 4. The second subset included 6 indicators and 3 objects, while the third subset
included 4 indicators and all 6 objects.
Results shown in Table 4 indicate that decisions on excluding or including
dependent indicators are highly related to the ratio of the number of indicators to
the number of objects. When the number of indicators is twice or higher the number
of objects, then dependent indicators in the dataset that have problems of quality
(incomplete, inaccurate, etc.) can be safely discarded from the analysis. In other
words, the effect on the quality of the decisions obtained from the Copeland ranking
method will be minimal. The first two subsets in Table 4 would result in excellent
129
Table 4 SRCC between ranks of original and extended data based on data in Table 3 for different
data subsets
No Objects
Original indicators
(Table 3)
Ratio +
Extended
indicators
Type of
correlation
SRCC *
1
a,b,c
All indicators except:
• SiO 2
• Carbonate
• LSI
• Hardness
23/3 = 7.67 Carbonate
Linear
0.9996
LSI
Complex
0.9996
Hardness
Multi-linear 0.9966
2
a,b,c
• Ca ++
• Mg ++
• pH
• Electrical
Conductivity
• Bicarbonate
• Alkalinity
6/3 = 2
Carbonate
Linear
1
LSI
Complex
0.9449
Hardness
Multi-linear 1
3
a,b,c,d,e,f • Ca ++
• Mg++
• pH
• Na +
4/6 = 0.67
Carbonate
Linear
0.7314
LSI
Complex
0.9112
Hardness
Multi-linear 0.9580
+ Ratio = number of indicators/number of objects
* SRCC between objects’ ranks using original and extended indicators
dataset by adding one additional dependent indicator at a time. Starting with the
carbonate indicator, which is ‘linearly’ correlated to the total alkalinity indicator, as
described above, the extended dataset consists now of 3 objects and 24 indicators.
The new Copeland normalized ranks of the extended dataset are 0.235, 1 and 0.
The normalized ranks of the original (23 × 3) and extended (24 × 3) datasets are
then compared by evaluating their SRCC value (see Table 4). Similarly the original
dataset is extended to include the LSI and total hardness indicators.
The same procedure was applied for the second and third subsets, as shown in
Table 4. The second subset included 6 indicators and 3 objects, while the third subset
included 4 indicators and all 6 objects.
Results shown in Table 4 indicate that decisions on excluding or including
dependent indicators are highly related to the ratio of the number of indicators to
the number of objects. When the number of indicators is twice or higher the number
of objects, then dependent indicators in the dataset that have problems of quality
(incomplete, inaccurate, etc.) can be safely discarded from the analysis. In other
words, the effect on the quality of the decisions obtained from the Copeland ranking
method will be minimal. The first two subsets in Table 4 would result in excellent