

88
A. Kerber and R. Bruggemann
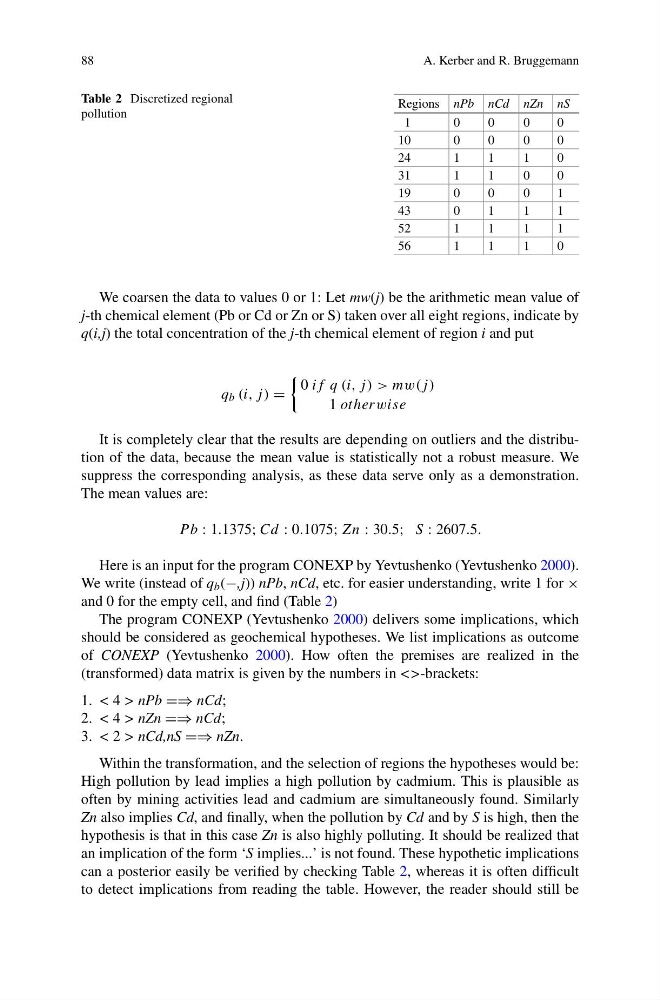
Table 2 Discretized regional
pollution
Regions nPb nCd nZn nS
1
0
0
0
0
10
0
0
0
0
24
1
1
1
0
31
1
1
0
0
19
0
0
0
1
43
0
1
1
1
52
1
1
1
1
56
1
1
1
0
We coarsen the data to values 0 or 1: Let mw(j) be the arithmetic mean value of
j-th chemical element (Pb or Cd or Zn or S) taken over all eight regions, indicate by
q(i,j) the total concentration of the j-th chemical element of region i and put
q b (i, j ) =
0 if q (i, j ) > mw(j)
1 otherwise
It is completely clear that the results are depending on outliers and the distribution of the data, because the mean value is statistically not a robust measure. We
suppress the corresponding analysis, as these data serve only as a demonstration.
The mean values are:
P b : 1.1375; Cd : 0.1075; Zn : 30.5; S : 2607.5.
Here is an input for the program CONEXP by Yevtushenko (Yevtushenko 2000).
We write (instead of q b (−,j)) nPb, nCd, etc. for easier understanding, write 1 for ×
and 0 for the empty cell, and find (Table 2)
The program CONEXP (Yevtushenko 2000) delivers some implications, which
should be considered as geochemical hypotheses. We list implications as outcome
of CONEXP (Yevtushenko 2000). How often the premises are realized in the
(transformed) data matrix is given by the numbers in <>-brackets:
1. < 4 > nPb =⇒ nCd;
2. < 4 > nZn =⇒ nCd;
3. < 2 > nCd,nS =⇒ nZn.
Within the transformation, and the selection of regions the hypotheses would be:
High pollution by lead implies a high pollution by cadmium. This is plausible as
often by mining activities lead and cadmium are simultaneously found. Similarly
Zn also implies Cd, and finally, when the pollution by Cd and by S is high, then the
hypothesis is that in this case Zn is also highly polluting. It should be realized that
an implication of the form ‘S implies...’ is not found. These hypothetic implications
can a posterior easily be verified by checking Table 2, whereas it is often difficult
to detect implications from reading the table. However, the reader should still be
A. Kerber and R. Bruggemann
Table 2 Discretized regional
pollution
Regions nPb nCd nZn nS
1
0
0
0
0
10
0
0
0
0
24
1
1
1
0
31
1
1
0
0
19
0
0
0
1
43
0
1
1
1
52
1
1
1
1
56
1
1
1
0
We coarsen the data to values 0 or 1: Let mw(j) be the arithmetic mean value of
j-th chemical element (Pb or Cd or Zn or S) taken over all eight regions, indicate by
q(i,j) the total concentration of the j-th chemical element of region i and put
q b (i, j ) =
0 if q (i, j ) > mw(j)
1 otherwise
It is completely clear that the results are depending on outliers and the distribution of the data, because the mean value is statistically not a robust measure. We
suppress the corresponding analysis, as these data serve only as a demonstration.
The mean values are:
P b : 1.1375; Cd : 0.1075; Zn : 30.5; S : 2607.5.
Here is an input for the program CONEXP by Yevtushenko (Yevtushenko 2000).
We write (instead of q b (−,j)) nPb, nCd, etc. for easier understanding, write 1 for ×
and 0 for the empty cell, and find (Table 2)
The program CONEXP (Yevtushenko 2000) delivers some implications, which
should be considered as geochemical hypotheses. We list implications as outcome
of CONEXP (Yevtushenko 2000). How often the premises are realized in the
(transformed) data matrix is given by the numbers in <>-brackets:
1. < 4 > nPb =⇒ nCd;
2. < 4 > nZn =⇒ nCd;
3. < 2 > nCd,nS =⇒ nZn.
Within the transformation, and the selection of regions the hypotheses would be:
High pollution by lead implies a high pollution by cadmium. This is plausible as
often by mining activities lead and cadmium are simultaneously found. Similarly
Zn also implies Cd, and finally, when the pollution by Cd and by S is high, then the
hypothesis is that in this case Zn is also highly polluting. It should be realized that
an implication of the form ‘S implies...’ is not found. These hypothetic implications
can a posterior easily be verified by checking Table 2, whereas it is often difficult
to detect implications from reading the table. However, the reader should still be