

82
1.8. THE TANGENT LINE APPROXIMATION
• f is a differentiable function defined at every real number x
• f (2) = −1
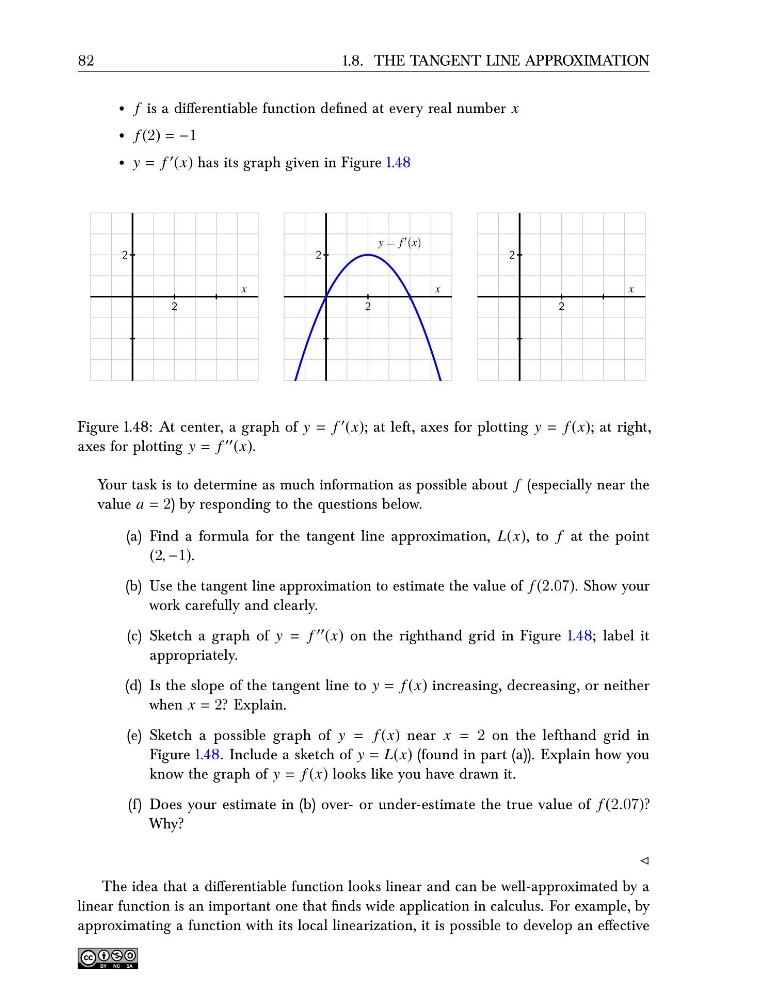
• y = f ′ (x) has its graph given in Figure 1.48
2
2
x
2
2
x
y = f ′ (x)
2
2
x
Figure 1.48: At center, a graph of y = f ′ (x); at left, axes for plotting y = f (x); at right,
axes for plotting y = f ′′ (x).
Your task is to determine as much information as possible about f (especially near the
value a = 2) by responding to the questions below.
(a) Find a formula for the tangent line approximation, L(x), to f at the point
(2, −1).
(b) Use the tangent line approximation to estimate the value of f (2.07). Show your
work carefully and clearly.
(c) Sketch a graph of y = f ′′ (x) on the righthand grid in Figure 1.48; label it
appropriately.
(d) Is the slope of the tangent line to y = f (x) increasing, decreasing, or neither
when x = 2? Explain.
(e) Sketch a possible graph of y = f (x) near x = 2 on the lefthand grid in
Figure 1.48. Include a sketch of y = L(x) (found in part (a)). Explain how you
know the graph of y = f (x) looks like you have drawn it.
(f) Does your estimate in (b) over- or under-estimate the true value of f (2.07)?
Why?
⊳
The idea that a differentiable function looks linear and can be well-approximated by a
linear function is an important one that finds wide application in calculus. For example, by
approximating a function with its local linearization, it is possible to develop an effective
1.8. THE TANGENT LINE APPROXIMATION
• f is a differentiable function defined at every real number x
• f (2) = −1
• y = f ′ (x) has its graph given in Figure 1.48
2
2
x
2
2
x
y = f ′ (x)
2
2
x
Figure 1.48: At center, a graph of y = f ′ (x); at left, axes for plotting y = f (x); at right,
axes for plotting y = f ′′ (x).
Your task is to determine as much information as possible about f (especially near the
value a = 2) by responding to the questions below.
(a) Find a formula for the tangent line approximation, L(x), to f at the point
(2, −1).
(b) Use the tangent line approximation to estimate the value of f (2.07). Show your
work carefully and clearly.
(c) Sketch a graph of y = f ′′ (x) on the righthand grid in Figure 1.48; label it
appropriately.
(d) Is the slope of the tangent line to y = f (x) increasing, decreasing, or neither
when x = 2? Explain.
(e) Sketch a possible graph of y = f (x) near x = 2 on the lefthand grid in
Figure 1.48. Include a sketch of y = L(x) (found in part (a)). Explain how you
know the graph of y = f (x) looks like you have drawn it.
(f) Does your estimate in (b) over- or under-estimate the true value of f (2.07)?
Why?
⊳
The idea that a differentiable function looks linear and can be well-approximated by a
linear function is an important one that finds wide application in calculus. For example, by
approximating a function with its local linearization, it is possible to develop an effective