

1.7. LIMITS, CONTINUITY, AND DIFFERENTIABILITY
69
to exist, explain why by discussing the left- and right-hand limits at the relevant
a-value.
(d) For which values of a is the following statement true?
lim
x→a
f (x) f (a)
(e) On the axes provided in Figure 1.37, sketch an accurate, labeled graph of
y = f (x). Be sure to carefully use open circles (◦) and filled circles (•) to
represent key points on the graph, as dictated by the piecewise formula.
⊳
Being continuous at a point
Intuitively, a function is continuous if we can draw it without ever lifting our pencil from
the page. Alternatively, we might say that the graph of a continuous function has no jumps
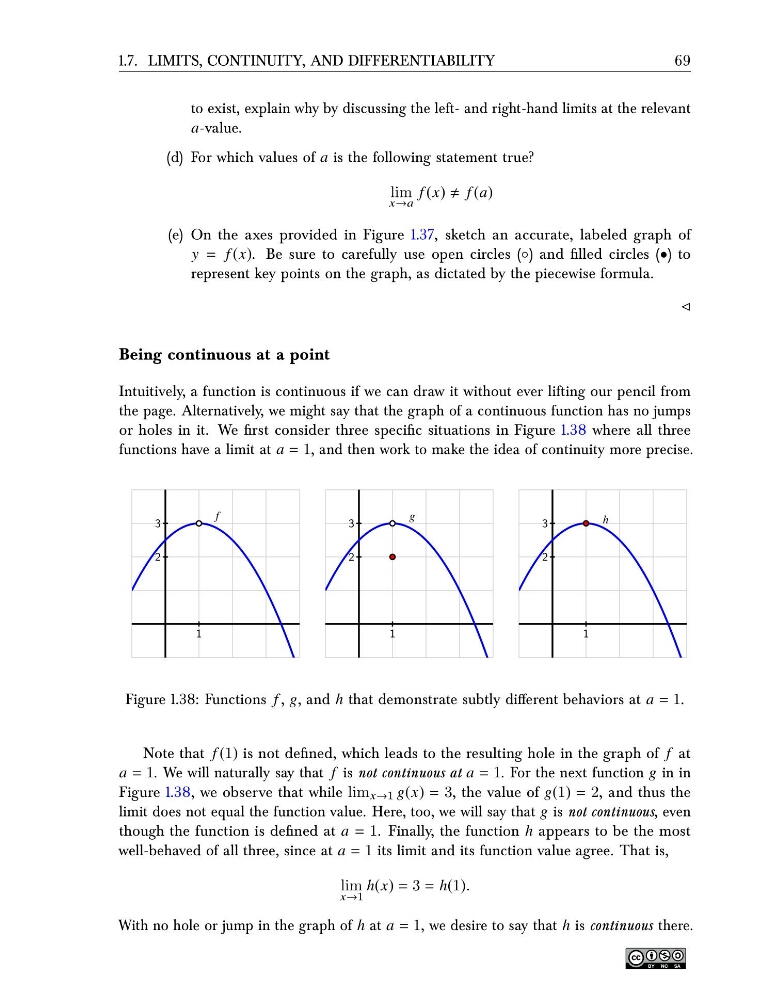
or holes in it. We first consider three specific situations in Figure 1.38 where all three
functions have a limit at a = 1, and then work to make the idea of continuity more precise.
1
2
3
f
1
2
3
g
1
2
3
h
Figure 1.38: Functions f , g, and h that demonstrate subtly different behaviors at a = 1.
Note that f (1) is not defined, which leads to the resulting hole in the graph of f at
a = 1. We will naturally say that f is not continuous at a = 1. For the next function g in in
Figure 1.38, we observe that while lim x→1 g(x) = 3, the value of g(1) = 2, and thus the
limit does not equal the function value. Here, too, we will say that g is not continuous, even
though the function is defined at a = 1. Finally, the function h appears to be the most
well-behaved of all three, since at a = 1 its limit and its function value agree. That is,
lim
x→1
h(x) = 3 = h(1).
With no hole or jump in the graph of h at a = 1, we desire to say that h is continuous there.
69
to exist, explain why by discussing the left- and right-hand limits at the relevant
a-value.
(d) For which values of a is the following statement true?
lim
x→a
f (x) f (a)
(e) On the axes provided in Figure 1.37, sketch an accurate, labeled graph of
y = f (x). Be sure to carefully use open circles (◦) and filled circles (•) to
represent key points on the graph, as dictated by the piecewise formula.
⊳
Being continuous at a point
Intuitively, a function is continuous if we can draw it without ever lifting our pencil from
the page. Alternatively, we might say that the graph of a continuous function has no jumps
or holes in it. We first consider three specific situations in Figure 1.38 where all three
functions have a limit at a = 1, and then work to make the idea of continuity more precise.
1
2
3
f
1
2
3
g
1
2
3
h
Figure 1.38: Functions f , g, and h that demonstrate subtly different behaviors at a = 1.
Note that f (1) is not defined, which leads to the resulting hole in the graph of f at
a = 1. We will naturally say that f is not continuous at a = 1. For the next function g in in
Figure 1.38, we observe that while lim x→1 g(x) = 3, the value of g(1) = 2, and thus the
limit does not equal the function value. Here, too, we will say that g is not continuous, even
though the function is defined at a = 1. Finally, the function h appears to be the most
well-behaved of all three, since at a = 1 its limit and its function value agree. That is,
lim
x→1
h(x) = 3 = h(1).
With no hole or jump in the graph of h at a = 1, we desire to say that h is continuous there.