

42
1.4. THE DERIVATIVE FUNCTION
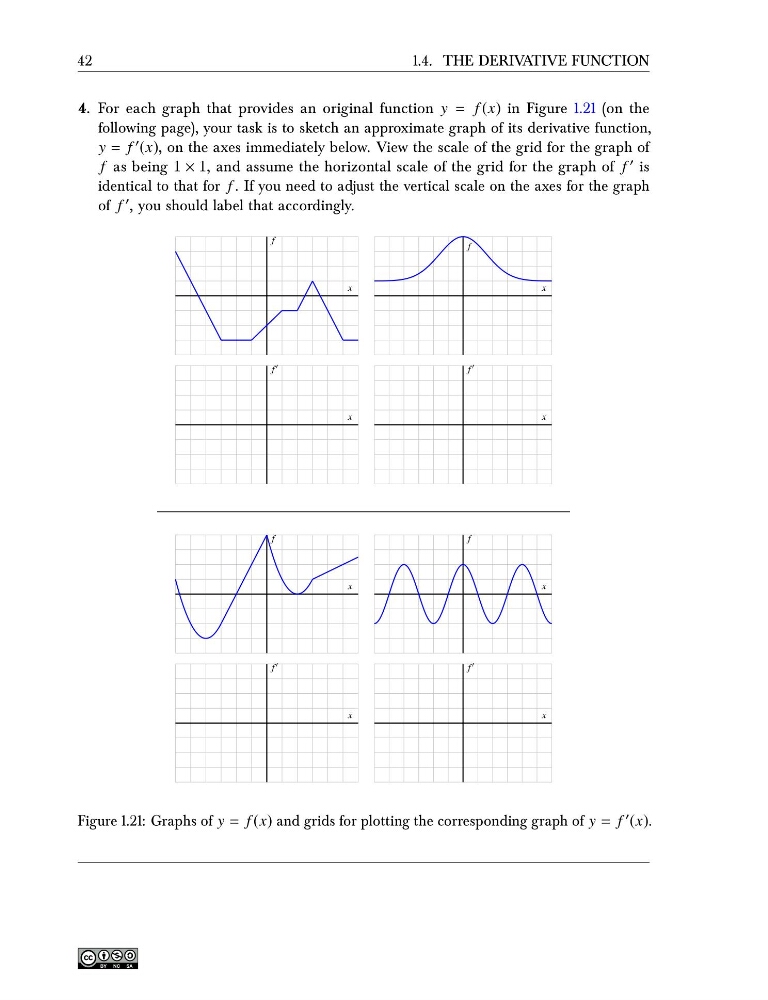
4. For each graph that provides an original function y = f (x) in Figure 1.21 (on the
following page), your task is to sketch an approximate graph of its derivative function,
y = f ′ (x), on the axes immediately below. View the scale of the grid for the graph of
f as being 1 × 1, and assume the horizontal scale of the grid for the graph of f ′ is
identical to that for f . If you need to adjust the vertical scale on the axes for the graph
of f ′ , you should label that accordingly.
f
x
f ′
x
f
x
f ′
x
f
x
f ′
x
f
x
f ′
x
Figure 1.21: Graphs of y = f (x) and grids for plotting the corresponding graph of y = f ′ (x).
1.4. THE DERIVATIVE FUNCTION
4. For each graph that provides an original function y = f (x) in Figure 1.21 (on the
following page), your task is to sketch an approximate graph of its derivative function,
y = f ′ (x), on the axes immediately below. View the scale of the grid for the graph of
f as being 1 × 1, and assume the horizontal scale of the grid for the graph of f ′ is
identical to that for f . If you need to adjust the vertical scale on the axes for the graph
of f ′ , you should label that accordingly.
f
x
f ′
x
f
x
f ′
x
f
x
f ′
x
f
x
f ′
x
Figure 1.21: Graphs of y = f (x) and grids for plotting the corresponding graph of y = f ′ (x).