

1.3. THE DERIVATIVE OF A FUNCTION AT A POINT
29
(c) Use the limit definition to compute the instantaneous rate of change of s with
respect to time, t, at the instant a = 1. Show your work using proper notation,
include units on your answer, and write one sentence to explain the meaning
of the value you found.
(d) On your graph in (a), sketch two lines: one whose slope represents the average
rate of change of s on [1, 2], the other whose slope represents the instantaneous
rate of change of s at the instant a = 1. Label each line clearly.
(e) For what values of a do you expect s ′ (a) to be positive? Why? Answer the
same questions when “positive” is replaced by “negative” and “zero.”
⊳
Activity 1.9.
A rapidly growing city in Arizona has its population P at time t, where t is the number
of decades after the year 2010, modeled by the formula P(t) = 25000e t/5 . Use this
function to respond to the following questions.
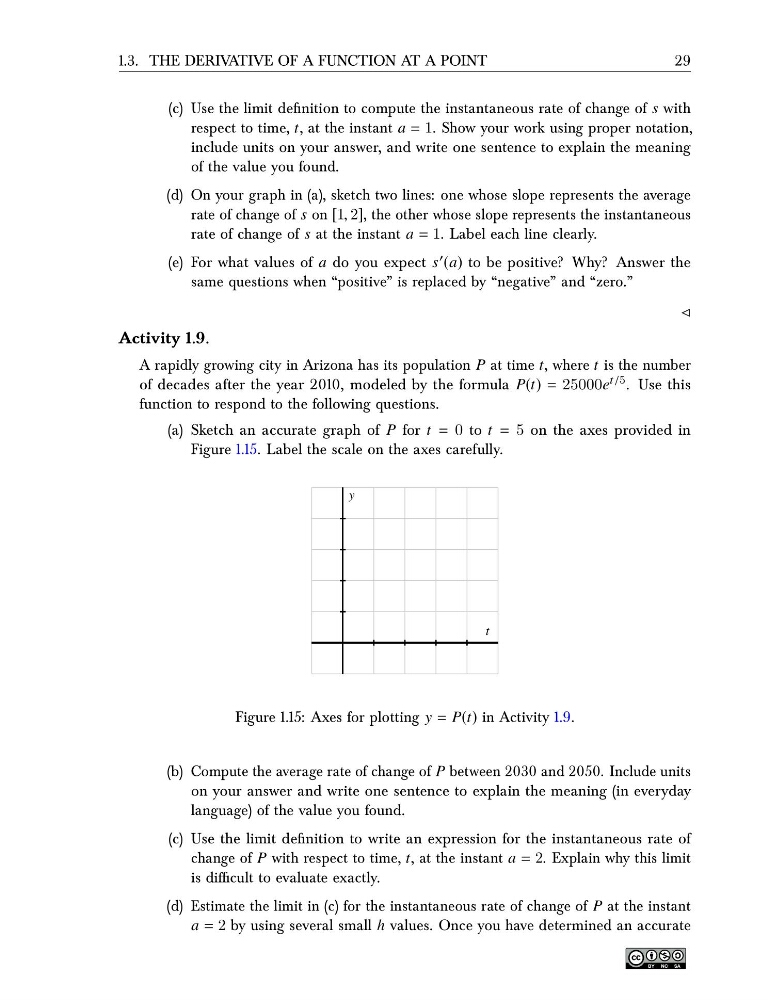
(a) Sketch an accurate graph of P for t = 0 to t = 5 on the axes provided in
Figure 1.15. Label the scale on the axes carefully.
t
y
Figure 1.15: Axes for plotting y = P(t) in Activity 1.9.
(b) Compute the average rate of change of P between 2030 and 2050. Include units
on your answer and write one sentence to explain the meaning (in everyday
language) of the value you found.
(c) Use the limit definition to write an expression for the instantaneous rate of
change of P with respect to time, t, at the instant a = 2. Explain why this limit
is difficult to evaluate exactly.
(d) Estimate the limit in (c) for the instantaneous rate of change of P at the instant
a = 2 by using several small h values. Once you have determined an accurate
29
(c) Use the limit definition to compute the instantaneous rate of change of s with
respect to time, t, at the instant a = 1. Show your work using proper notation,
include units on your answer, and write one sentence to explain the meaning
of the value you found.
(d) On your graph in (a), sketch two lines: one whose slope represents the average
rate of change of s on [1, 2], the other whose slope represents the instantaneous
rate of change of s at the instant a = 1. Label each line clearly.
(e) For what values of a do you expect s ′ (a) to be positive? Why? Answer the
same questions when “positive” is replaced by “negative” and “zero.”
⊳
Activity 1.9.
A rapidly growing city in Arizona has its population P at time t, where t is the number
of decades after the year 2010, modeled by the formula P(t) = 25000e t/5 . Use this
function to respond to the following questions.
(a) Sketch an accurate graph of P for t = 0 to t = 5 on the axes provided in
Figure 1.15. Label the scale on the axes carefully.
t
y
Figure 1.15: Axes for plotting y = P(t) in Activity 1.9.
(b) Compute the average rate of change of P between 2030 and 2050. Include units
on your answer and write one sentence to explain the meaning (in everyday
language) of the value you found.
(c) Use the limit definition to write an expression for the instantaneous rate of
change of P with respect to time, t, at the instant a = 2. Explain why this limit
is difficult to evaluate exactly.
(d) Estimate the limit in (c) for the instantaneous rate of change of P at the instant
a = 2 by using several small h values. Once you have determined an accurate