

400
7.2. QUALITATIVE BEHAVIOR OF SOLUTIONS TO DES
1
2
3
-2
-1
1
2
3
t
y
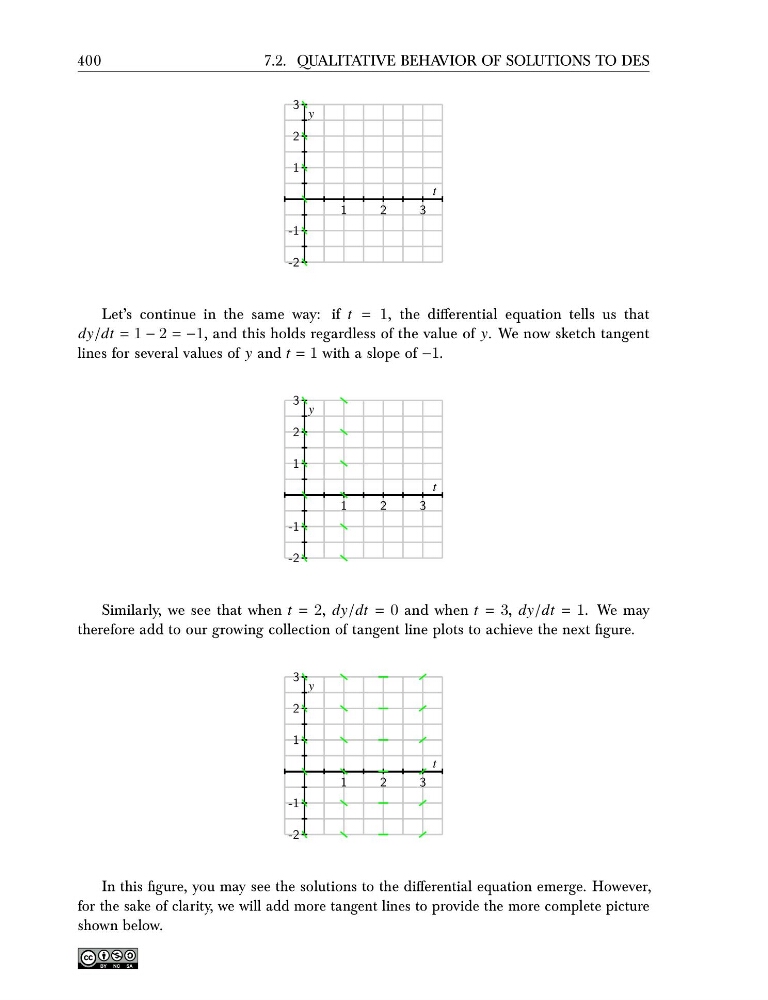
Let’s continue in the same way: if t = 1, the differential equation tells us that
dy/dt = 1 − 2 = −1, and this holds regardless of the value of y. We now sketch tangent
lines for several values of y and t = 1 with a slope of −1.
1
2
3
-2
-1
1
2
3
t
y
Similarly, we see that when t = 2, dy/dt = 0 and when t = 3, dy/dt = 1. We may
therefore add to our growing collection of tangent line plots to achieve the next figure.
1
2
3
-2
-1
1
2
3
t
y
In this figure, you may see the solutions to the differential equation emerge. However,
for the sake of clarity, we will add more tangent lines to provide the more complete picture
shown below.
7.2. QUALITATIVE BEHAVIOR OF SOLUTIONS TO DES
1
2
3
-2
-1
1
2
3
t
y
Let’s continue in the same way: if t = 1, the differential equation tells us that
dy/dt = 1 − 2 = −1, and this holds regardless of the value of y. We now sketch tangent
lines for several values of y and t = 1 with a slope of −1.
1
2
3
-2
-1
1
2
3
t
y
Similarly, we see that when t = 2, dy/dt = 0 and when t = 3, dy/dt = 1. We may
therefore add to our growing collection of tangent line plots to achieve the next figure.
1
2
3
-2
-1
1
2
3
t
y
In this figure, you may see the solutions to the differential equation emerge. However,
for the sake of clarity, we will add more tangent lines to provide the more complete picture
shown below.