

226
4.2. RIEMANN SUMS
x 0 x 1 x 2
x i x i+1
x n−1 x n
A 1 A 2
· · · A i+1
· · ·
y = f (x)
A n
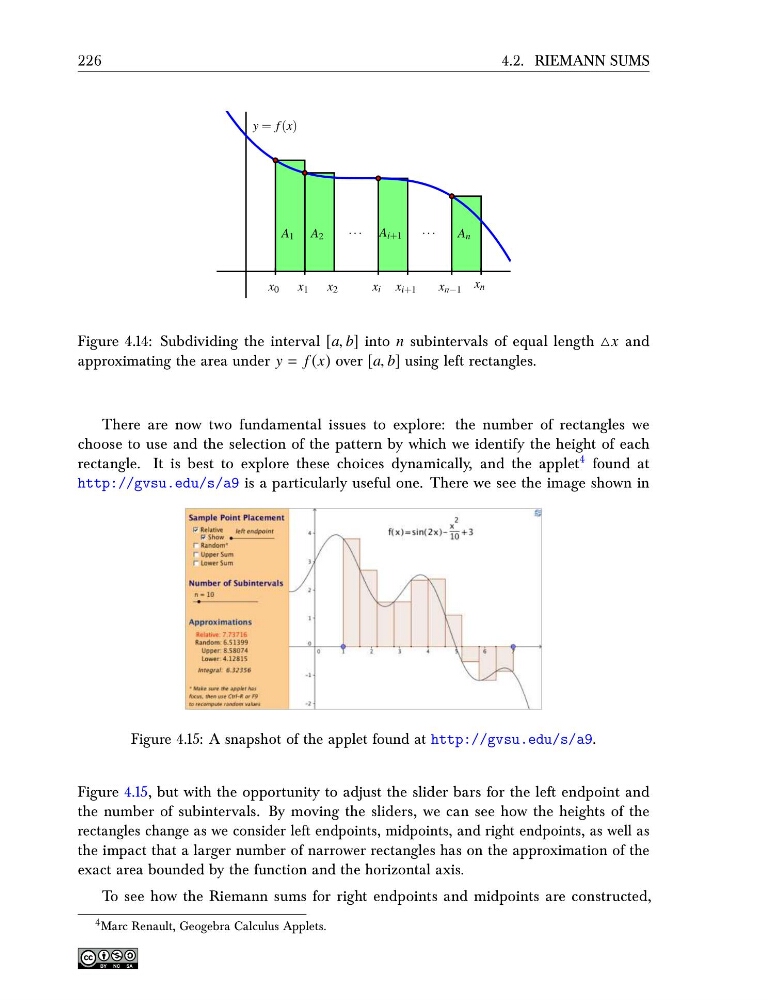
Figure 4.14: Subdividing the interval [a, b] into n subintervals of equal length △x and
approximating the area under y = f (x) over [a, b] using left rectangles.
There are now two fundamental issues to explore: the number of rectangles we
choose to use and the selection of the pattern by which we identify the height of each
rectangle. It is best to explore these choices dynamically, and the applet 4 found at
http://gvsu.edu/s/a9 is a particularly useful one. There we see the image shown in
Figure 4.15: A snapshot of the applet found at http://gvsu.edu/s/a9.
Figure 4.15, but with the opportunity to adjust the slider bars for the left endpoint and
the number of subintervals. By moving the sliders, we can see how the heights of the
rectangles change as we consider left endpoints, midpoints, and right endpoints, as well as
the impact that a larger number of narrower rectangles has on the approximation of the
exact area bounded by the function and the horizontal axis.
To see how the Riemann sums for right endpoints and midpoints are constructed,
4 Marc Renault, Geogebra Calculus Applets.
4.2. RIEMANN SUMS
x 0 x 1 x 2
x i x i+1
x n−1 x n
A 1 A 2
· · · A i+1
· · ·
y = f (x)
A n
Figure 4.14: Subdividing the interval [a, b] into n subintervals of equal length △x and
approximating the area under y = f (x) over [a, b] using left rectangles.
There are now two fundamental issues to explore: the number of rectangles we
choose to use and the selection of the pattern by which we identify the height of each
rectangle. It is best to explore these choices dynamically, and the applet 4 found at
http://gvsu.edu/s/a9 is a particularly useful one. There we see the image shown in
Figure 4.15: A snapshot of the applet found at http://gvsu.edu/s/a9.
Figure 4.15, but with the opportunity to adjust the slider bars for the left endpoint and
the number of subintervals. By moving the sliders, we can see how the heights of the
rectangles change as we consider left endpoints, midpoints, and right endpoints, as well as
the impact that a larger number of narrower rectangles has on the approximation of the
exact area bounded by the function and the horizontal axis.
To see how the Riemann sums for right endpoints and midpoints are constructed,
4 Marc Renault, Geogebra Calculus Applets.