

98
2.2. THE SINE AND COSINE FUNCTIONS
(c) Use the limit definition of the derivative to estimate f ′ (0) by using small values
of h, and compare the result to your visual estimate for the slope of the tangent
line to y = f (x) at x = 0 in (b). Using periodicity, what does this result suggest
about f ′ (2π)? about f ′ (−2π)?
(d) Based on your work in (a), (b), and (c), sketch an accurate graph of y = f ′ (x)
on the axes adjacent to the graph of y = f (x).
(e) What familiar function do you think is the derivative of f (x) = sin(x)?
-1
1
−2π
−π
π
2π
−2π
−π
π
2π
-1
1
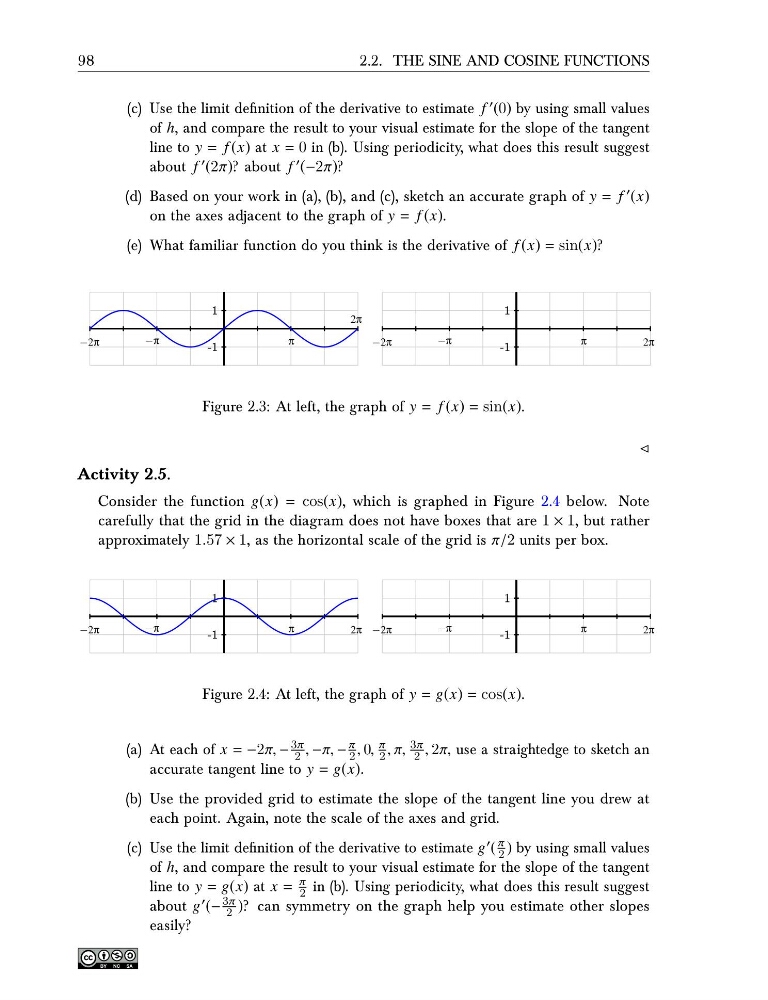
Figure 2.3: At left, the graph of y = f (x) = sin(x).
⊳
Activity 2.5.
Consider the function g(x) = cos(x), which is graphed in Figure 2.4 below. Note
carefully that the grid in the diagram does not have boxes that are 1 × 1, but rather
approximately 1.57 × 1, as the horizontal scale of the grid is π/2 units per box.
-1
1
−2π
−π
π
2π −2π
−π
π
2π
-1
1
Figure 2.4: At left, the graph of y = g(x) = cos(x).
(a) At each of x = −2π, −
3π
2 , −π, −
π
2 , 0,
π
2 , π,
3π
2 , 2π, use a straightedge to sketch an
accurate tangent line to y = g(x).
(b) Use the provided grid to estimate the slope of the tangent line you drew at
each point. Again, note the scale of the axes and grid.
(c) Use the limit definition of the derivative to estimate g ′ (
π
2 ) by using small values
of h, and compare the result to your visual estimate for the slope of the tangent
line to y = g(x) at x =
π
2 in (b). Using periodicity, what does this result suggest
about g ′ (−
3π
2 )? can symmetry on the graph help you estimate other slopes
easily?
2.2. THE SINE AND COSINE FUNCTIONS
(c) Use the limit definition of the derivative to estimate f ′ (0) by using small values
of h, and compare the result to your visual estimate for the slope of the tangent
line to y = f (x) at x = 0 in (b). Using periodicity, what does this result suggest
about f ′ (2π)? about f ′ (−2π)?
(d) Based on your work in (a), (b), and (c), sketch an accurate graph of y = f ′ (x)
on the axes adjacent to the graph of y = f (x).
(e) What familiar function do you think is the derivative of f (x) = sin(x)?
-1
1
−2π
−π
π
2π
−2π
−π
π
2π
-1
1
Figure 2.3: At left, the graph of y = f (x) = sin(x).
⊳
Activity 2.5.
Consider the function g(x) = cos(x), which is graphed in Figure 2.4 below. Note
carefully that the grid in the diagram does not have boxes that are 1 × 1, but rather
approximately 1.57 × 1, as the horizontal scale of the grid is π/2 units per box.
-1
1
−2π
−π
π
2π −2π
−π
π
2π
-1
1
Figure 2.4: At left, the graph of y = g(x) = cos(x).
(a) At each of x = −2π, −
3π
2 , −π, −
π
2 , 0,
π
2 , π,
3π
2 , 2π, use a straightedge to sketch an
accurate tangent line to y = g(x).
(b) Use the provided grid to estimate the slope of the tangent line you drew at
each point. Again, note the scale of the axes and grid.
(c) Use the limit definition of the derivative to estimate g ′ (
π
2 ) by using small values
of h, and compare the result to your visual estimate for the slope of the tangent
line to y = g(x) at x =
π
2 in (b). Using periodicity, what does this result suggest
about g ′ (−
3π
2 )? can symmetry on the graph help you estimate other slopes
easily?