

corrosion rate. The actual time required can vary from af ew seconds up
to 20 min, depending on the metal–process combination beingm easured.
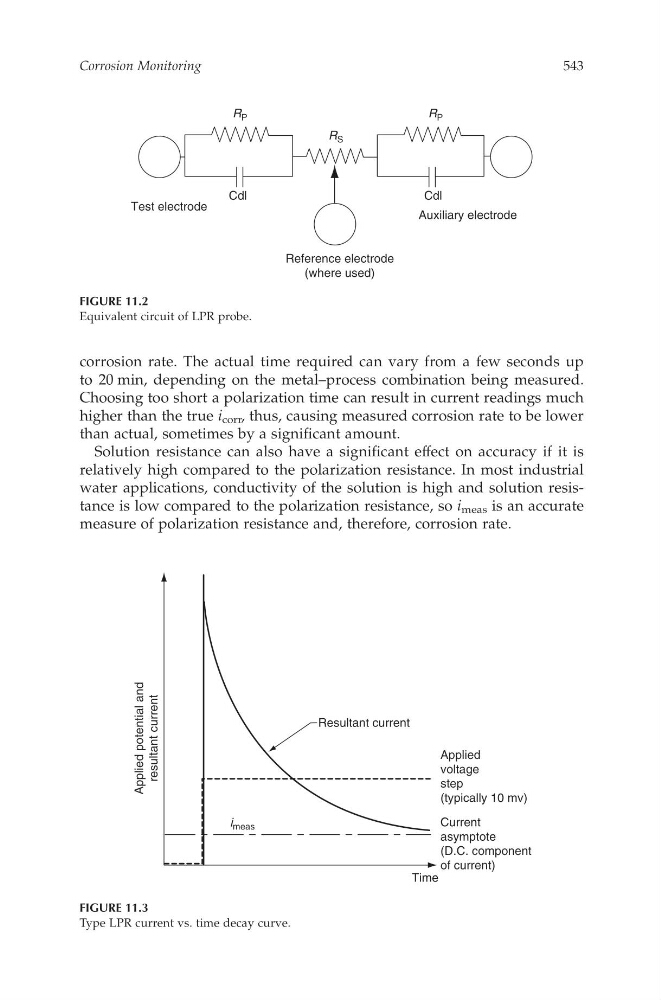
Choosing toos hort ap olarization time can result in current readings much
higher than the true i corr ,thus, causing measured corrosion rate to be lower
than actual, sometimes by asignificant amount.
Solution resistance can also have as ignificant effect on accuracy if it is
relatively high compared to the polarization resistance. In most industrial
water applications, conductivity of the solutioni sh igh and solution resistance is low compared to the polarization resistance, so i meas is an accurate
measure of polarization resistance and, therefore, corrosion rate.
R P
R P
R S
Cdl
Cdl
Test electrode
Auxiliary electrode
Reference electrode
(where used)
FIGURE 11.2
Equivalentc ircuit of LPR probe.
Resultant current
Applied
voltage
step
(typically 10 mv)
Applied potential and
resultant current
Current
asymptote
(D.C. component
of current)
Time
i meas
FIGURE 11.3
Type LPR current vs. time decay curve.
Corrosion Monitoring
543
CAT8247—CHAPTER 11—6/10/2006—12:56—SRIDHAR—XML MODEL B–pp. 533–547