

412
18 Climatic Change and Water Resources
the national average annual precipitation did not change significantly. The period
from 1980–2000 saw 3.7 mm more average annual precipitation than 1956–1979,
but there was a significant variance between southern and northern China. Since the
1980s, precipitation in northern China is lower, especially in the Hai River Basin, the
middle and lower reaches of the Yellow River Basin and the Shandong Peninsula.
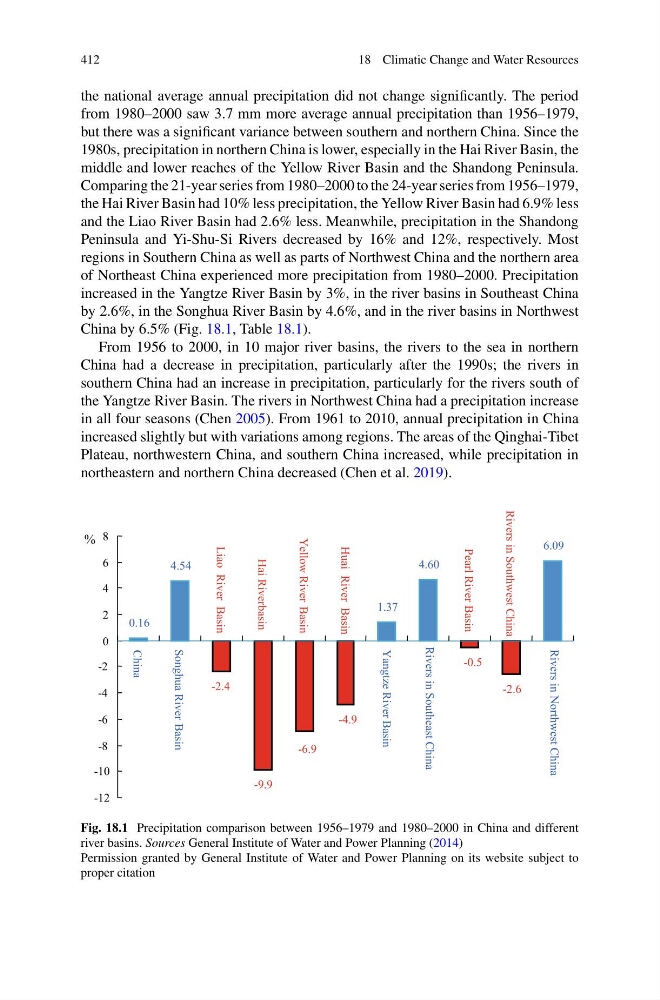
Comparing the 21-year series from 1980–2000 to the 24-year series from 1956–1979,
the Hai River Basin had 10% less precipitation, the Yellow River Basin had 6.9% less
and the Liao River Basin had 2.6% less. Meanwhile, precipitation in the Shandong
Peninsula and Yi-Shu-Si Rivers decreased by 16% and 12%, respectively. Most
regions in Southern China as well as parts of Northwest China and the northern area
of Northeast China experienced more precipitation from 1980–2000. Precipitation
increased in the Yangtze River Basin by 3%, in the river basins in Southeast China
by 2.6%, in the Songhua River Basin by 4.6%, and in the river basins in Northwest
China by 6.5% (Fig. 18.1, Table 18.1).
From 1956 to 2000, in 10 major river basins, the rivers to the sea in northern
China had a decrease in precipitation, particularly after the 1990s; the rivers in
southern China had an increase in precipitation, particularly for the rivers south of
the Yangtze River Basin. The rivers in Northwest China had a precipitation increase
in all four seasons (Chen 2005). From 1961 to 2010, annual precipitation in China
increased slightly but with variations among regions. The areas of the Qinghai-Tibet
Plateau, northwestern China, and southern China increased, while precipitation in
northeastern and northern China decreased (Chen et al. 2019).
0.16
4.54
-2.4
-9.9
-6.9
-4.9
1.37
4.60
-0.5
-2.6
6.09
-12
-10
-8
-6
-4
-2
0
2
4
6
8
China
Songhua River Basin
Liao River Basin
Hai Riverbasin
Yellow River Basin
Huai River Basin
Yangtze River Basin
Rivers in Southeast China
Pearl River Basin
Rivers in Southwest China
Rivers in Northwest China
%
Fig. 18.1 Precipitation comparison between 1956–1979 and 1980–2000 in China and different
river basins. Sources General Institute of Water and Power Planning (2014)
Permission granted by General Institute of Water and Power Planning on its website subject to
proper citation
18 Climatic Change and Water Resources
the national average annual precipitation did not change significantly. The period
from 1980–2000 saw 3.7 mm more average annual precipitation than 1956–1979,
but there was a significant variance between southern and northern China. Since the
1980s, precipitation in northern China is lower, especially in the Hai River Basin, the
middle and lower reaches of the Yellow River Basin and the Shandong Peninsula.
Comparing the 21-year series from 1980–2000 to the 24-year series from 1956–1979,
the Hai River Basin had 10% less precipitation, the Yellow River Basin had 6.9% less
and the Liao River Basin had 2.6% less. Meanwhile, precipitation in the Shandong
Peninsula and Yi-Shu-Si Rivers decreased by 16% and 12%, respectively. Most
regions in Southern China as well as parts of Northwest China and the northern area
of Northeast China experienced more precipitation from 1980–2000. Precipitation
increased in the Yangtze River Basin by 3%, in the river basins in Southeast China
by 2.6%, in the Songhua River Basin by 4.6%, and in the river basins in Northwest
China by 6.5% (Fig. 18.1, Table 18.1).
From 1956 to 2000, in 10 major river basins, the rivers to the sea in northern
China had a decrease in precipitation, particularly after the 1990s; the rivers in
southern China had an increase in precipitation, particularly for the rivers south of
the Yangtze River Basin. The rivers in Northwest China had a precipitation increase
in all four seasons (Chen 2005). From 1961 to 2010, annual precipitation in China
increased slightly but with variations among regions. The areas of the Qinghai-Tibet
Plateau, northwestern China, and southern China increased, while precipitation in
northeastern and northern China decreased (Chen et al. 2019).
0.16
4.54
-2.4
-9.9
-6.9
-4.9
1.37
4.60
-0.5
-2.6
6.09
-12
-10
-8
-6
-4
-2
0
2
4
6
8
China
Songhua River Basin
Liao River Basin
Hai Riverbasin
Yellow River Basin
Huai River Basin
Yangtze River Basin
Rivers in Southeast China
Pearl River Basin
Rivers in Southwest China
Rivers in Northwest China
%
Fig. 18.1 Precipitation comparison between 1956–1979 and 1980–2000 in China and different
river basins. Sources General Institute of Water and Power Planning (2014)
Permission granted by General Institute of Water and Power Planning on its website subject to
proper citation