

1.4 Water Resources Development and Use
19
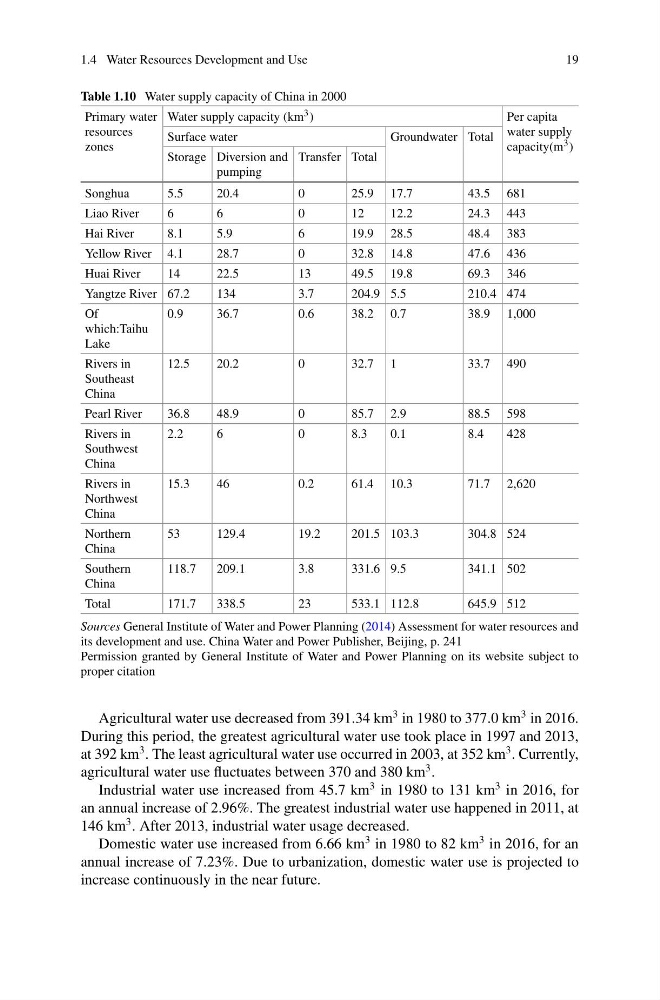
Table 1.10 Water supply capacity of China in 2000
Primary water
resources
zones
Water supply capacity (km 3 )
Per capita
water supply
capacity(m 3 )
Surface water
Groundwater Total
Storage Diversion and
pumping
Transfer Total
Songhua
5.5
20.4
0
25.9 17.7
43.5 681
Liao River
6
6
0
12
12.2
24.3 443
Hai River
8.1
5.9
6
19.9 28.5
48.4 383
Yellow River 4.1
28.7
0
32.8 14.8
47.6 436
Huai River
14
22.5
13
49.5 19.8
69.3 346
Yangtze River 67.2
134
3.7
204.9 5.5
210.4 474
Of
which:Taihu
Lake
0.9
36.7
0.6
38.2 0.7
38.9 1,000
Rivers in
Southeast
China
12.5
20.2
0
32.7 1
33.7 490
Pearl River
36.8
48.9
0
85.7 2.9
88.5 598
Rivers in
Southwest
China
2.2
6
0
8.3
0.1
8.4
428
Rivers in
Northwest
China
15.3
46
0.2
61.4 10.3
71.7 2,620
Northern
China
53
129.4
19.2
201.5 103.3
304.8 524
Southern
China
118.7
209.1
3.8
331.6 9.5
341.1 502
Total
171.7
338.5
23
533.1 112.8
645.9 512
Sources General Institute of Water and Power Planning (2014) Assessment for water resources and
its development and use. China Water and Power Publisher, Beijing, p. 241
Permission granted by General Institute of Water and Power Planning on its website subject to
proper citation
Agricultural water use decreased from 391.34 km
3 in 1980 to 377.0 km
3 in 2016.
During this period, the greatest agricultural water use took place in 1997 and 2013,
at 392 km
3 . The least agricultural water use occurred in 2003, at 352 km
3 . Currently,
agricultural water use fluctuates between 370 and 380 km
3 .
Industrial water use increased from 45.7 km
3 in 1980 to 131 km
3 in 2016, for
an annual increase of 2.96%. The greatest industrial water use happened in 2011, at
146 km
3 . After 2013, industrial water usage decreased.
Domestic water use increased from 6.66 km
3 in 1980 to 82 km
3 in 2016, for an
annual increase of 7.23%. Due to urbanization, domestic water use is projected to
increase continuously in the near future.
19
Table 1.10 Water supply capacity of China in 2000
Primary water
resources
zones
Water supply capacity (km 3 )
Per capita
water supply
capacity(m 3 )
Surface water
Groundwater Total
Storage Diversion and
pumping
Transfer Total
Songhua
5.5
20.4
0
25.9 17.7
43.5 681
Liao River
6
6
0
12
12.2
24.3 443
Hai River
8.1
5.9
6
19.9 28.5
48.4 383
Yellow River 4.1
28.7
0
32.8 14.8
47.6 436
Huai River
14
22.5
13
49.5 19.8
69.3 346
Yangtze River 67.2
134
3.7
204.9 5.5
210.4 474
Of
which:Taihu
Lake
0.9
36.7
0.6
38.2 0.7
38.9 1,000
Rivers in
Southeast
China
12.5
20.2
0
32.7 1
33.7 490
Pearl River
36.8
48.9
0
85.7 2.9
88.5 598
Rivers in
Southwest
China
2.2
6
0
8.3
0.1
8.4
428
Rivers in
Northwest
China
15.3
46
0.2
61.4 10.3
71.7 2,620
Northern
China
53
129.4
19.2
201.5 103.3
304.8 524
Southern
China
118.7
209.1
3.8
331.6 9.5
341.1 502
Total
171.7
338.5
23
533.1 112.8
645.9 512
Sources General Institute of Water and Power Planning (2014) Assessment for water resources and
its development and use. China Water and Power Publisher, Beijing, p. 241
Permission granted by General Institute of Water and Power Planning on its website subject to
proper citation
Agricultural water use decreased from 391.34 km
3 in 1980 to 377.0 km
3 in 2016.
During this period, the greatest agricultural water use took place in 1997 and 2013,
at 392 km
3 . The least agricultural water use occurred in 2003, at 352 km
3 . Currently,
agricultural water use fluctuates between 370 and 380 km
3 .
Industrial water use increased from 45.7 km
3 in 1980 to 131 km
3 in 2016, for
an annual increase of 2.96%. The greatest industrial water use happened in 2011, at
146 km
3 . After 2013, industrial water usage decreased.
Domestic water use increased from 6.66 km
3 in 1980 to 82 km
3 in 2016, for an
annual increase of 7.23%. Due to urbanization, domestic water use is projected to
increase continuously in the near future.