

6
1 Physical Settings and Water Challenges
1.2 Hydrology
1.2.1 Precipitation
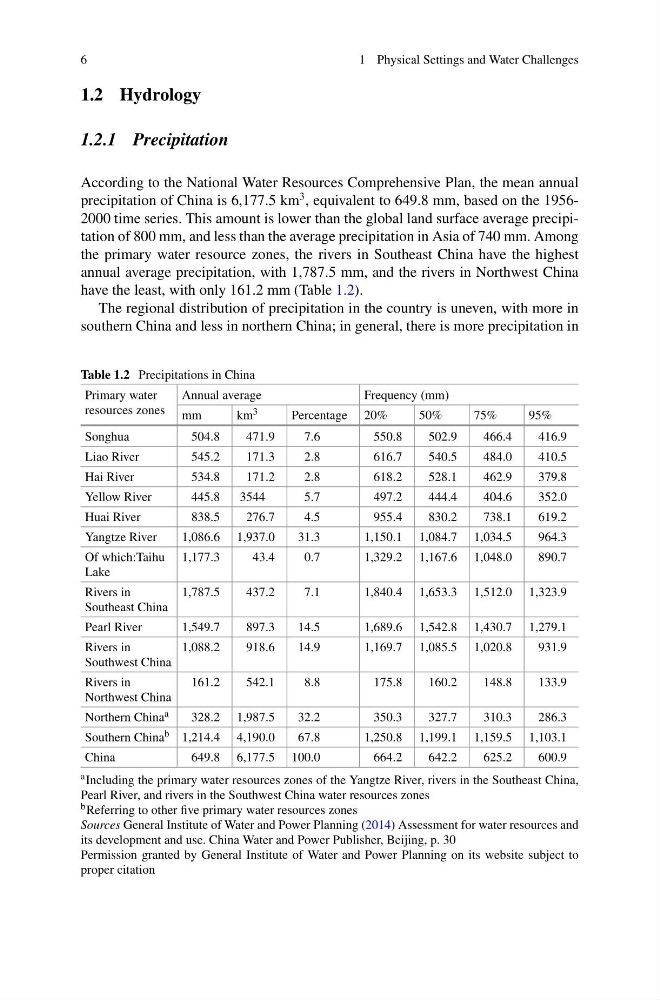
According to the National Water Resources Comprehensive Plan, the mean annual
precipitation of China is 6,177.5 km
3 , equivalent to 649.8 mm, based on the 19562000 time series. This amount is lower than the global land surface average precipitation of 800 mm, and less than the average precipitation in Asia of 740 mm. Among
the primary water resource zones, the rivers in Southeast China have the highest
annual average precipitation, with 1,787.5 mm, and the rivers in Northwest China
have the least, with only 161.2 mm (Table 1.2).
The regional distribution of precipitation in the country is uneven, with more in
southern China and less in northern China; in general, there is more precipitation in
Table 1.2 Precipitations in China
Primary water
resources zones
Annual average
Frequency (mm)
mm
km 3
Percentage 20%
50%
75%
95%
Songhua
504.8
471.9
7.6
550.8
502.9
466.4
416.9
Liao River
545.2
171.3
2.8
616.7
540.5
484.0
410.5
Hai River
534.8
171.2
2.8
618.2
528.1
462.9
379.8
Yellow River
445.8
3544
5.7
497.2
444.4
404.6
352.0
Huai River
838.5
276.7
4.5
955.4
830.2
738.1
619.2
Yangtze River
1,086.6 1,937.0
31.3
1,150.1 1,084.7 1,034.5
964.3
Of which:Taihu
Lake
1,177.3
43.4
0.7
1,329.2 1,167.6 1,048.0
890.7
Rivers in
Southeast China
1,787.5
437.2
7.1
1,840.4 1,653.3 1,512.0 1,323.9
Pearl River
1,549.7
897.3
14.5
1,689.6 1,542.8 1,430.7 1,279.1
Rivers in
Southwest China
1,088.2
918.6
14.9
1,169.7 1,085.5 1,020.8
931.9
Rivers in
Northwest China
161.2
542.1
8.8
175.8
160.2
148.8
133.9
Northern China a
328.2 1,987.5
32.2
350.3
327.7
310.3
286.3
Southern China b 1,214.4 4,190.0
67.8
1,250.8 1,199.1 1,159.5 1,103.1
China
649.8 6,177.5 100.0
664.2
642.2
625.2
600.9
a Including the primary water resources zones of the Yangtze River, rivers in the Southeast China,
Pearl River, and rivers in the Southwest China water resources zones
b Referring to other five primary water resources zones
Sources General Institute of Water and Power Planning (2014) Assessment for water resources and
its development and use. China Water and Power Publisher, Beijing, p. 30
Permission granted by General Institute of Water and Power Planning on its website subject to
proper citation
1 Physical Settings and Water Challenges
1.2 Hydrology
1.2.1 Precipitation
According to the National Water Resources Comprehensive Plan, the mean annual
precipitation of China is 6,177.5 km
3 , equivalent to 649.8 mm, based on the 19562000 time series. This amount is lower than the global land surface average precipitation of 800 mm, and less than the average precipitation in Asia of 740 mm. Among
the primary water resource zones, the rivers in Southeast China have the highest
annual average precipitation, with 1,787.5 mm, and the rivers in Northwest China
have the least, with only 161.2 mm (Table 1.2).
The regional distribution of precipitation in the country is uneven, with more in
southern China and less in northern China; in general, there is more precipitation in
Table 1.2 Precipitations in China
Primary water
resources zones
Annual average
Frequency (mm)
mm
km 3
Percentage 20%
50%
75%
95%
Songhua
504.8
471.9
7.6
550.8
502.9
466.4
416.9
Liao River
545.2
171.3
2.8
616.7
540.5
484.0
410.5
Hai River
534.8
171.2
2.8
618.2
528.1
462.9
379.8
Yellow River
445.8
3544
5.7
497.2
444.4
404.6
352.0
Huai River
838.5
276.7
4.5
955.4
830.2
738.1
619.2
Yangtze River
1,086.6 1,937.0
31.3
1,150.1 1,084.7 1,034.5
964.3
Of which:Taihu
Lake
1,177.3
43.4
0.7
1,329.2 1,167.6 1,048.0
890.7
Rivers in
Southeast China
1,787.5
437.2
7.1
1,840.4 1,653.3 1,512.0 1,323.9
Pearl River
1,549.7
897.3
14.5
1,689.6 1,542.8 1,430.7 1,279.1
Rivers in
Southwest China
1,088.2
918.6
14.9
1,169.7 1,085.5 1,020.8
931.9
Rivers in
Northwest China
161.2
542.1
8.8
175.8
160.2
148.8
133.9
Northern China a
328.2 1,987.5
32.2
350.3
327.7
310.3
286.3
Southern China b 1,214.4 4,190.0
67.8
1,250.8 1,199.1 1,159.5 1,103.1
China
649.8 6,177.5 100.0
664.2
642.2
625.2
600.9
a Including the primary water resources zones of the Yangtze River, rivers in the Southeast China,
Pearl River, and rivers in the Southwest China water resources zones
b Referring to other five primary water resources zones
Sources General Institute of Water and Power Planning (2014) Assessment for water resources and
its development and use. China Water and Power Publisher, Beijing, p. 30
Permission granted by General Institute of Water and Power Planning on its website subject to
proper citation