

Corrosion Mechanisms
19
2.5 Measuring Polarization
While polarization always leads to lower rates of corrosion, identifying the
effects of the environment on polarization of the corrosion circuit is useful in predicting corrosion behavior. Measurement of the corrosion circuit
while the corrosion potential is varied is possible with the apparatus shown
in Figure 2.9.
Turning to the example of iron corroding in hydrochloric acid solution,
if the iron sample is maintained at the natural corrosion potential of −0.2V,
no current will flow through the auxiliary electrode. The plot of this data
point in the study would equate to that of A or C in Figure 2.10. As the
potential is raised, anodically polarized, the current flow will increase and
curve AB will approximate the behavior of the true anodic polarization
curve. Alternatively, if the potential were lowered below −0.2V, the current
measurements would result in the curve CD and approximate the nature
of the cathodic polarization curve. By using the straight-line portion of the
Tafel regions of these curves, an approximation of the corrosion current
can be made.
Most often it is the anodic polarization behavior that is useful in understanding alloy systems in various environments. Anodic polarization tests
can be conducted with relatively simple equipment and the scans themselves
can be done in a short time. They are extremely useful in studying the activepassive behavior that many materials exhibit. As the name suggests, these
Concentration
polarization
Activation polarization
β
i L
Log i
η
o
+
–
FigurE 2.8
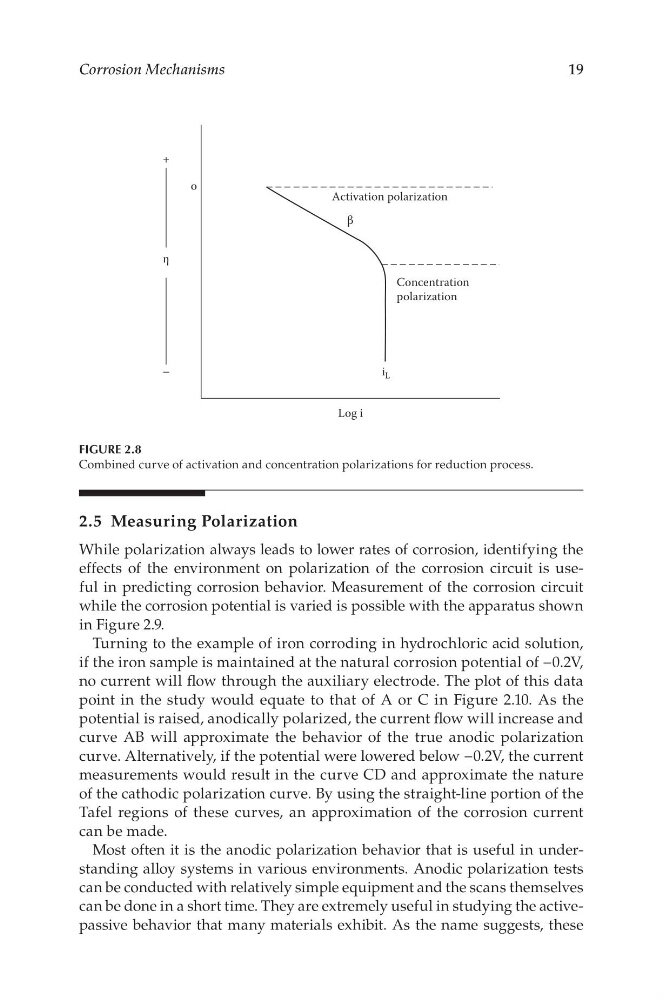
Combined curve of activation and concentration polarizations for reduction process.
19
2.5 Measuring Polarization
While polarization always leads to lower rates of corrosion, identifying the
effects of the environment on polarization of the corrosion circuit is useful in predicting corrosion behavior. Measurement of the corrosion circuit
while the corrosion potential is varied is possible with the apparatus shown
in Figure 2.9.
Turning to the example of iron corroding in hydrochloric acid solution,
if the iron sample is maintained at the natural corrosion potential of −0.2V,
no current will flow through the auxiliary electrode. The plot of this data
point in the study would equate to that of A or C in Figure 2.10. As the
potential is raised, anodically polarized, the current flow will increase and
curve AB will approximate the behavior of the true anodic polarization
curve. Alternatively, if the potential were lowered below −0.2V, the current
measurements would result in the curve CD and approximate the nature
of the cathodic polarization curve. By using the straight-line portion of the
Tafel regions of these curves, an approximation of the corrosion current
can be made.
Most often it is the anodic polarization behavior that is useful in understanding alloy systems in various environments. Anodic polarization tests
can be conducted with relatively simple equipment and the scans themselves
can be done in a short time. They are extremely useful in studying the activepassive behavior that many materials exhibit. As the name suggests, these
Concentration
polarization
Activation polarization
β
i L
Log i
η
o
+
–
FigurE 2.8
Combined curve of activation and concentration polarizations for reduction process.