

256
Fundamentals of Corrosion
The mechanism of the corrosion cell is represented in Figure 8.2 using the
Evans diagram. In the Evans diagram, the cathodic current is expressed in
the same direction as the anodic current.
In Figure 8.2, E a shows the single potential for metal/metal ion equilibria at
the anode, and E C shows the single potential for H 2 /H + , or for O 2 /OH − equilibria at the cathode. The single potential is given by the Nernst equation,
that is,
E = E
RT
nF
a
o
+
ln
where E is the single potential, E o is the standard single potential, R is the
gas constant, T is the absolute temperature, n is the charge on the ion, F is
the Faraday constant, and a is the activity of the ion. E is equal to E o when a
is equal to 1. The standard single potential is E o and it shows the degree of
activity of, for example, metal and gas.
Table 8.1 shows the standard single potential of various metal and nonmetal reactants. The arrangement of metals in order of electrode potential is
called the electrochemical series: the more negative the single potential, the
more active the metal. When the corrosion circuit is formed, that is, when
the electromotive force (E C − E a ) is supplied, the current flows between the
anode and the cathode. The anode electrode potential is shifted to the noble
direction, the cathodic electrode potential is also shifted, but to the less noble
Cathode
Anode
area
area
Metal
Metal
e
e
OH
–
M
n+
Air
Electrolyte
O 2
O 2
OH
–
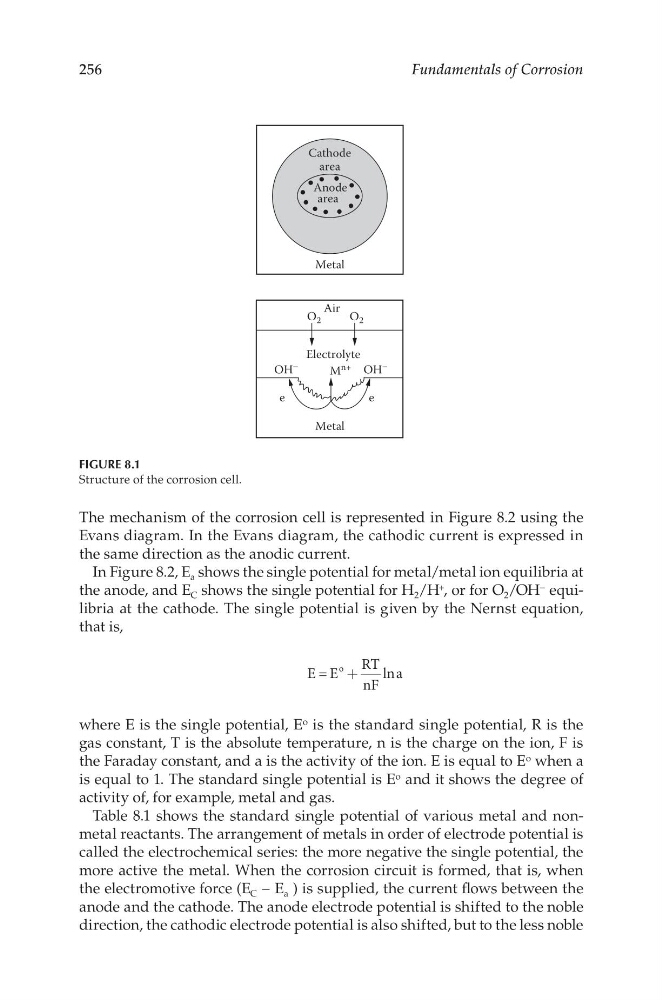
FigurE 8.1
Structure of the corrosion cell.
Fundamentals of Corrosion
The mechanism of the corrosion cell is represented in Figure 8.2 using the
Evans diagram. In the Evans diagram, the cathodic current is expressed in
the same direction as the anodic current.
In Figure 8.2, E a shows the single potential for metal/metal ion equilibria at
the anode, and E C shows the single potential for H 2 /H + , or for O 2 /OH − equilibria at the cathode. The single potential is given by the Nernst equation,
that is,
E = E
RT
nF
a
o
+
ln
where E is the single potential, E o is the standard single potential, R is the
gas constant, T is the absolute temperature, n is the charge on the ion, F is
the Faraday constant, and a is the activity of the ion. E is equal to E o when a
is equal to 1. The standard single potential is E o and it shows the degree of
activity of, for example, metal and gas.
Table 8.1 shows the standard single potential of various metal and nonmetal reactants. The arrangement of metals in order of electrode potential is
called the electrochemical series: the more negative the single potential, the
more active the metal. When the corrosion circuit is formed, that is, when
the electromotive force (E C − E a ) is supplied, the current flows between the
anode and the cathode. The anode electrode potential is shifted to the noble
direction, the cathodic electrode potential is also shifted, but to the less noble
Cathode
Anode
area
area
Metal
Metal
e
e
OH
–
M
n+
Air
Electrolyte
O 2
O 2
OH
–
FigurE 8.1
Structure of the corrosion cell.