

Graphical solution of equations 159
Ϫ10
Ϫ8
Ϫ6
Ϫ4
Ϫ2
Ϫ0.6
y ϭ Ϫ5x 2 ϩ 9x ϩ 7.2
0.9
2.4
0
Ϫ1
1
2
3
2
4
6
8
10
11.25
12
y
x
Figure 19.10
y ϭ 2x 2
y ϭ 8
y ϭ x ϩ 3
Ϫ2
Ϫ1
0
2
4
6
8
10
A
C
D
B
y
1 1.5 2
x
Figure 19.11
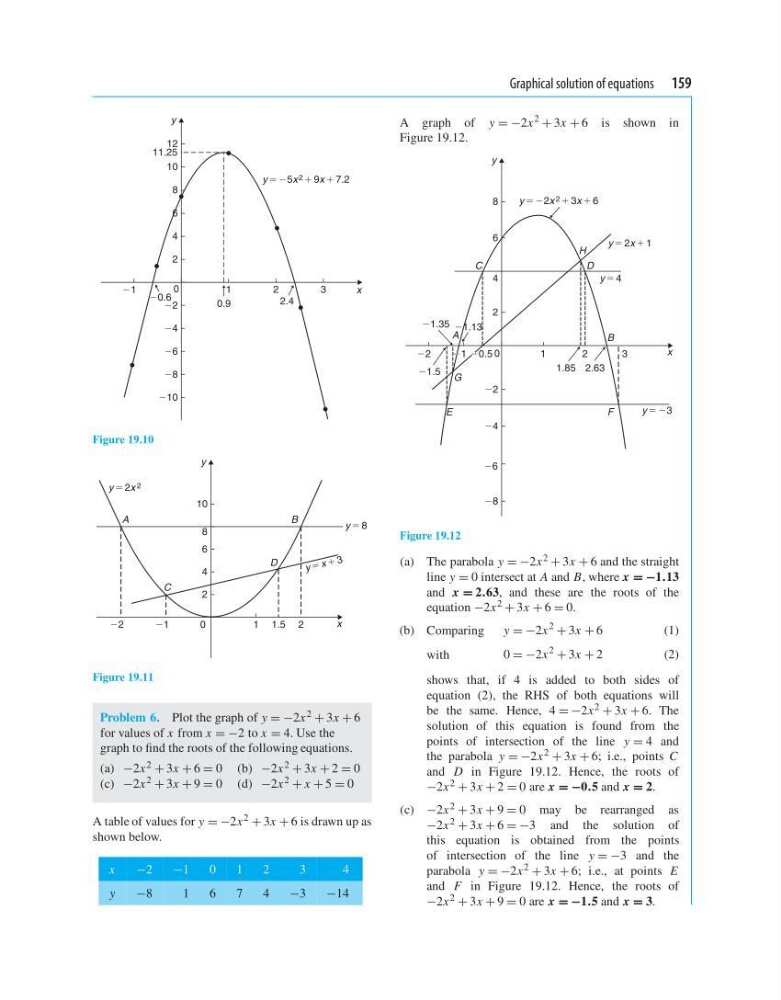
Problem 6. Plot the graph of y = −2x 2 + 3x + 6
for values of x from x = −2 to x = 4. Use the
graph to find the roots of the following equations.
(a) −2x 2 + 3x + 6 = 0 (b) −2x 2 + 3x + 2 = 0
(c) −2x 2 + 3x + 9 = 0 (d) −2x 2 + x + 5 = 0
A table of values for y = −2x 2 + 3x + 6 is drawn up as
shown below.
x
−2
−1
0
1
2
3
4
y
−8
1
6
7
4
−3
−14
A graph of y = −2x
2
+ 3x + 6 is shown in
Figure 19.12.
28
26
24
22
21.13
21.35
22
21.5 G
B
A
D
C
H
F
y 5 23
y 5 4
y 5 2x 1 1
y 5 22x 2 1 3x 1 6
x
E
1
2
1.85 2.63
3
0
2
4
6
8
y
20.5
21
Figure 19.12
(a) The parabola y = −2x 2 + 3x + 6 and the straight
line y = 0 intersect at A and B, where x = −1.13
and x = 2.63, and these are the roots of the
equation −2x 2 + 3x + 6 = 0.
(b) Comparing
y = −2x
2
+ 3x + 6
( 1 )
with
0 = −2x
2
+ 3x + 2
( 2 )
shows that, if 4 is added to both sides of
equation (2), the RHS of both equations will
be the same. Hence, 4 = −2x 2 + 3x + 6. The
solution of this equation is found from the
points of intersection of the line y = 4 and
the parabola y = −2x 2 + 3x + 6; i.e., points C
and D in Figure 19.12. Hence, the roots of
−2x 2 + 3x + 2 = 0 are x = −0.5 and x = 2.
(c) −2x 2 + 3x + 9 = 0 may be rearranged as
−2x 2 + 3x + 6 = −3 and the solution of
this equation is obtained from the points
of intersection of the line y = −3 and the
parabola y = −2x 2 + 3x + 6; i.e., at points E
and F in Figure 19.12. Hence, the roots of
−2x 2 + 3x + 9 = 0 are x = −1.5 and x = 3.
Ϫ10
Ϫ8
Ϫ6
Ϫ4
Ϫ2
Ϫ0.6
y ϭ Ϫ5x 2 ϩ 9x ϩ 7.2
0.9
2.4
0
Ϫ1
1
2
3
2
4
6
8
10
11.25
12
y
x
Figure 19.10
y ϭ 2x 2
y ϭ 8
y ϭ x ϩ 3
Ϫ2
Ϫ1
0
2
4
6
8
10
A
C
D
B
y
1 1.5 2
x
Figure 19.11
Problem 6. Plot the graph of y = −2x 2 + 3x + 6
for values of x from x = −2 to x = 4. Use the
graph to find the roots of the following equations.
(a) −2x 2 + 3x + 6 = 0 (b) −2x 2 + 3x + 2 = 0
(c) −2x 2 + 3x + 9 = 0 (d) −2x 2 + x + 5 = 0
A table of values for y = −2x 2 + 3x + 6 is drawn up as
shown below.
x
−2
−1
0
1
2
3
4
y
−8
1
6
7
4
−3
−14
A graph of y = −2x
2
+ 3x + 6 is shown in
Figure 19.12.
28
26
24
22
21.13
21.35
22
21.5 G
B
A
D
C
H
F
y 5 23
y 5 4
y 5 2x 1 1
y 5 22x 2 1 3x 1 6
x
E
1
2
1.85 2.63
3
0
2
4
6
8
y
20.5
21
Figure 19.12
(a) The parabola y = −2x 2 + 3x + 6 and the straight
line y = 0 intersect at A and B, where x = −1.13
and x = 2.63, and these are the roots of the
equation −2x 2 + 3x + 6 = 0.
(b) Comparing
y = −2x
2
+ 3x + 6
( 1 )
with
0 = −2x
2
+ 3x + 2
( 2 )
shows that, if 4 is added to both sides of
equation (2), the RHS of both equations will
be the same. Hence, 4 = −2x 2 + 3x + 6. The
solution of this equation is found from the
points of intersection of the line y = 4 and
the parabola y = −2x 2 + 3x + 6; i.e., points C
and D in Figure 19.12. Hence, the roots of
−2x 2 + 3x + 2 = 0 are x = −0.5 and x = 2.
(c) −2x 2 + 3x + 9 = 0 may be rearranged as
−2x 2 + 3x + 6 = −3 and the solution of
this equation is obtained from the points
of intersection of the line y = −3 and the
parabola y = −2x 2 + 3x + 6; i.e., at points E
and F in Figure 19.12. Hence, the roots of
−2x 2 + 3x + 9 = 0 are x = −1.5 and x = 3.