

Panel Tilt and Latitude
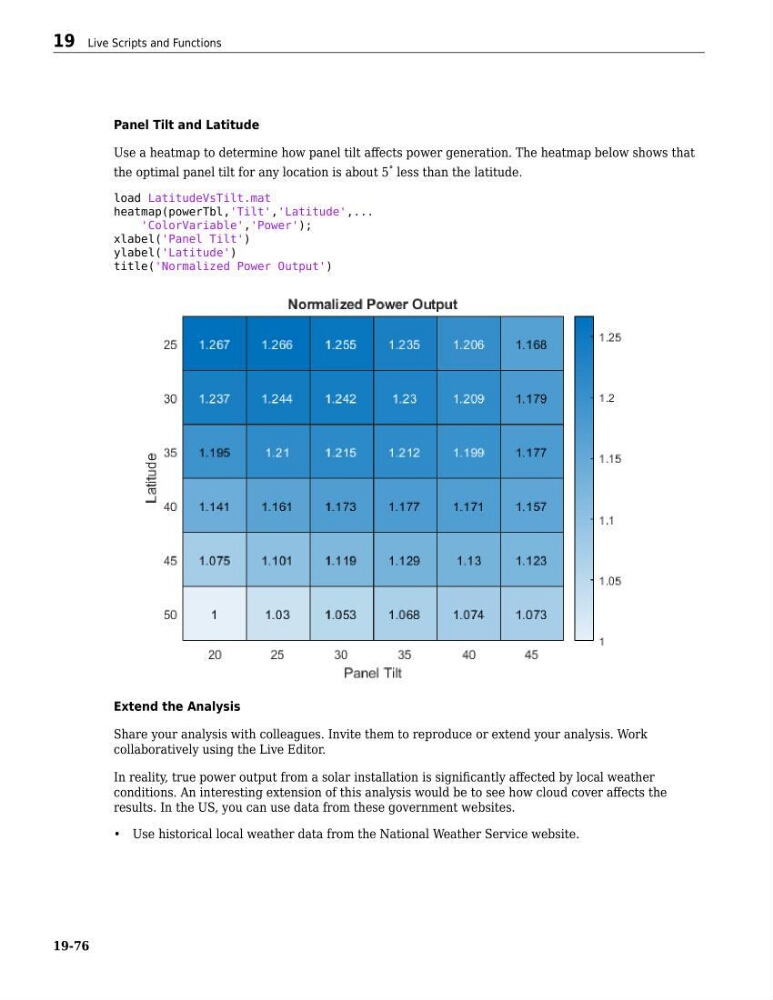
Use a heatmap to determine how panel tilt affects power generation. The heatmap below shows that
the optimal panel tilt for any location is about 5
∘ less than the latitude.
load LatitudeVsTilt.mat
heatmap(powerTbl,'Tilt','Latitude',...
'ColorVariable','Power');
xlabel('Panel Tilt')
ylabel('Latitude')
title('Normalized Power Output')
Extend the Analysis
Share your analysis with colleagues. Invite them to reproduce or extend your analysis. Work
collaboratively using the Live Editor.
In reality, true power output from a solar installation is significantly affected by local weather
conditions. An interesting extension of this analysis would be to see how cloud cover affects the
results. In the US, you can use data from these government websites.
• Use historical local weather data from the National Weather Service website.
19 Live Scripts and Functions
19-76