

Expected daily electical output for 01-Jun-2019 = 33.4223 kW-hrs
Power Generation for the Whole Year
Hover over a plot to interact with it. Interacting with a plot in the Live Editor will generate code that
you can then add to your script.
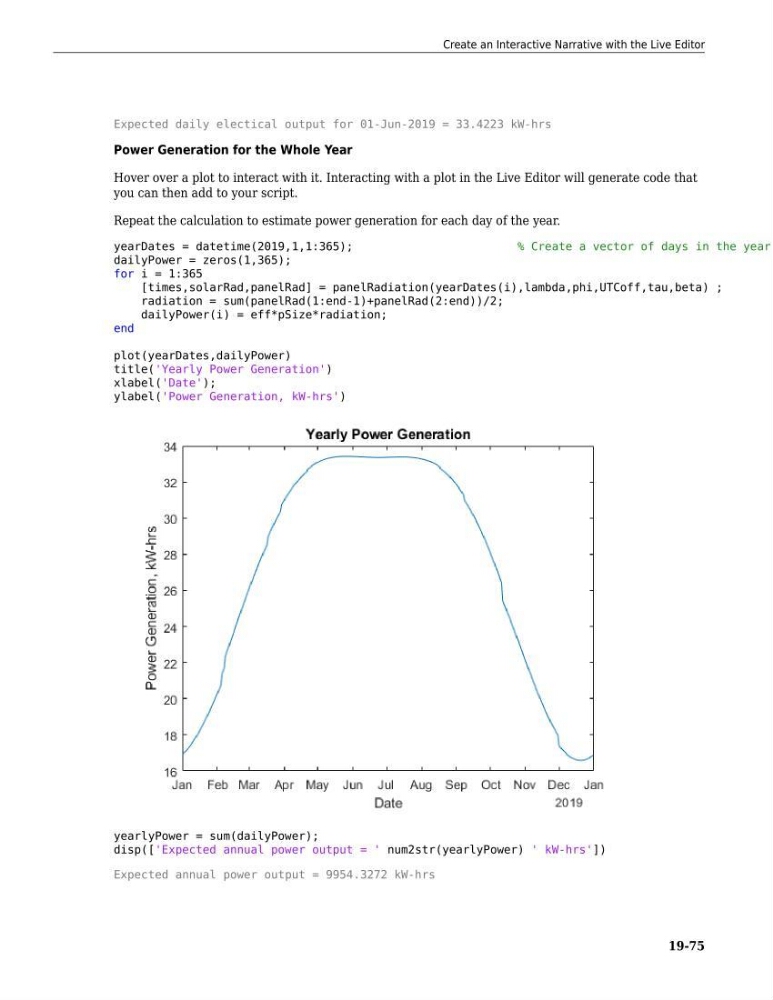
Repeat the calculation to estimate power generation for each day of the year.
yearDates = datetime(2019,1,1:365);
% Create a vector of days in the year
dailyPower = zeros(1,365);
for i = 1:365
[times,solarRad,panelRad] = panelRadiation(yearDates(i),lambda,phi,UTCoff,tau,beta) ;
radiation = sum(panelRad(1:end-1)+panelRad(2:end))/2;
dailyPower(i) = eff*pSize*radiation;
end
plot(yearDates,dailyPower)
title('Yearly Power Generation')
xlabel('Date');
ylabel('Power Generation, kW-hrs')
yearlyPower = sum(dailyPower);
disp(['Expected annual power output = ' num2str(yearlyPower) ' kW-hrs'])
Expected annual power output = 9954.3272 kW-hrs
Create an Interactive Narrative with the Live Editor
19-75