

3
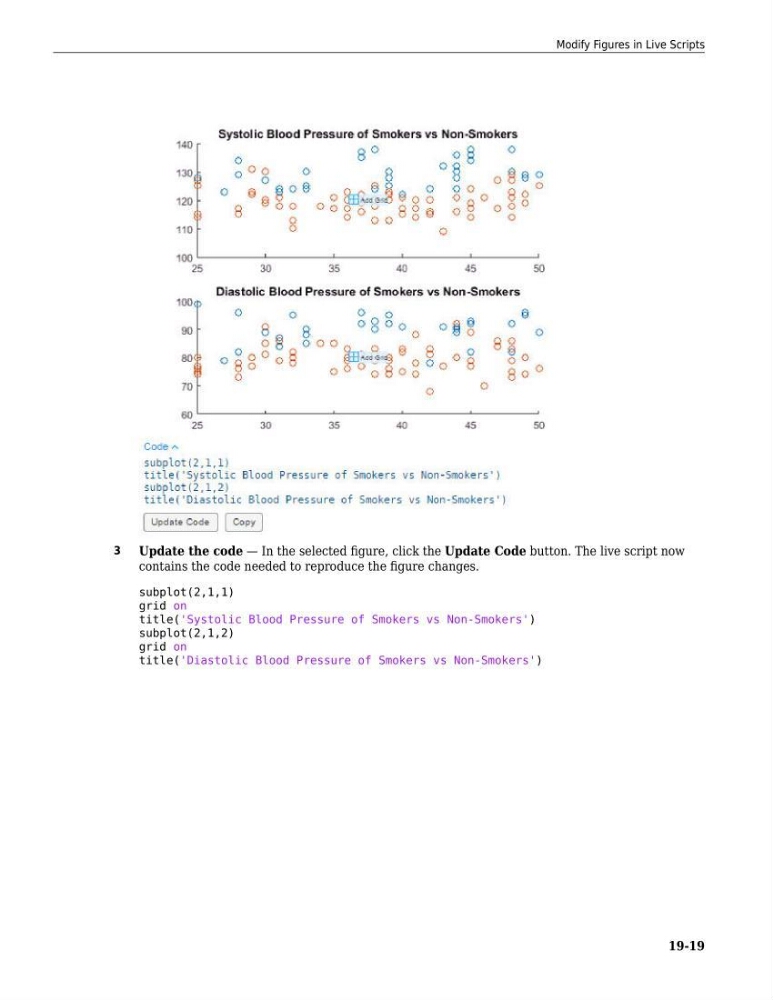
Update the code — In the selected figure, click the Update Code button. The live script now
contains the code needed to reproduce the figure changes.
subplot(2,1,1)
grid on
title('Systolic Blood Pressure of Smokers vs Non-Smokers')
subplot(2,1,2)
grid on
title('Diastolic Blood Pressure of Smokers vs Non-Smokers')
Modify Figures in Live Scripts
19-19