

xticklabels({'Sun','Mon','Tue','Wed','Thu','Fri','Sat'})
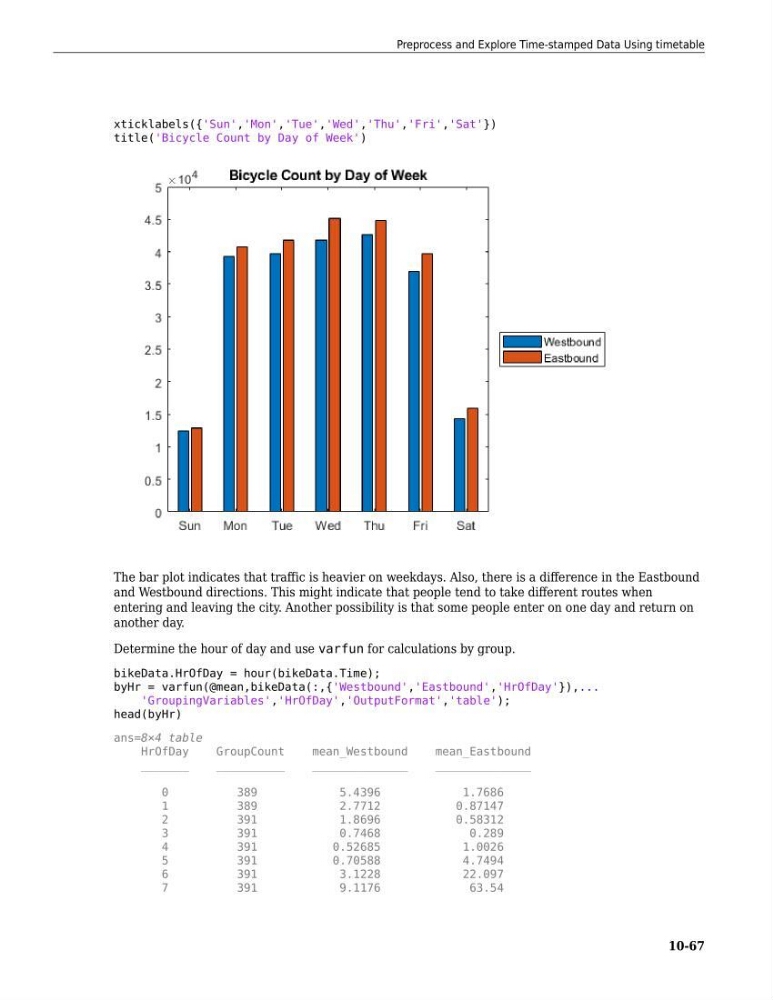
title('Bicycle Count by Day of Week')
The bar plot indicates that traffic is heavier on weekdays. Also, there is a difference in the Eastbound
and Westbound directions. This might indicate that people tend to take different routes when
entering and leaving the city. Another possibility is that some people enter on one day and return on
another day.
Determine the hour of day and use varfun for calculations by group.
bikeData.HrOfDay = hour(bikeData.Time);
byHr = varfun(@mean,bikeData(:,{'Westbound','Eastbound','HrOfDay'}),...
'GroupingVariables','HrOfDay','OutputFormat','table');
head(byHr)
ans=8×4 table
HrOfDay
GroupCount
mean_Westbound
mean_Eastbound
_______
__________
______________
______________
0
389
5.4396
1.7686
1
389
2.7712
0.87147
2
391
1.8696
0.58312
3
391
0.7468
0.289
4
391
0.52685
1.0026
5
391
0.70588
4.7494
6
391
3.1228
22.097
7
391
9.1176
63.54
Preprocess and Explore Time-stamped Data Using timetable
10-67
title('Bicycle Count by Day of Week')
The bar plot indicates that traffic is heavier on weekdays. Also, there is a difference in the Eastbound
and Westbound directions. This might indicate that people tend to take different routes when
entering and leaving the city. Another possibility is that some people enter on one day and return on
another day.
Determine the hour of day and use varfun for calculations by group.
bikeData.HrOfDay = hour(bikeData.Time);
byHr = varfun(@mean,bikeData(:,{'Westbound','Eastbound','HrOfDay'}),...
'GroupingVariables','HrOfDay','OutputFormat','table');
head(byHr)
ans=8×4 table
HrOfDay
GroupCount
mean_Westbound
mean_Eastbound
_______
__________
______________
______________
0
389
5.4396
1.7686
1
389
2.7712
0.87147
2
391
1.8696
0.58312
3
391
0.7468
0.289
4
391
0.52685
1.0026
5
391
0.70588
4.7494
6
391
3.1228
22.097
7
391
9.1176
63.54
Preprocess and Explore Time-stamped Data Using timetable
10-67