

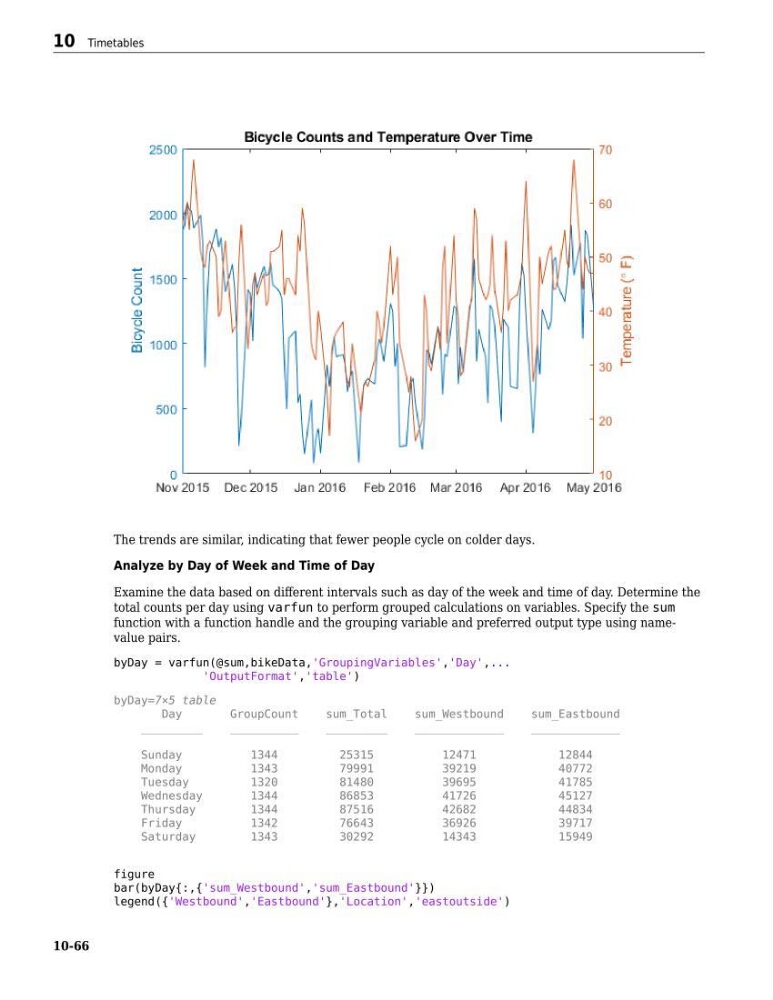
The trends are similar, indicating that fewer people cycle on colder days.
Analyze by Day of Week and Time of Day
Examine the data based on different intervals such as day of the week and time of day. Determine the
total counts per day using varfun to perform grouped calculations on variables. Specify the sum
function with a function handle and the grouping variable and preferred output type using namevalue pairs.
byDay = varfun(@sum,bikeData,'GroupingVariables','Day',...
'OutputFormat','table')
byDay=7×5 table
Day
GroupCount
sum_Total
sum_Westbound
sum_Eastbound
_________
__________
_________
_____________
_____________
Sunday
1344
25315
12471
12844
Monday
1343
79991
39219
40772
Tuesday
1320
81480
39695
41785
Wednesday
1344
86853
41726
45127
Thursday
1344
87516
42682
44834
Friday
1342
76643
36926
39717
Saturday
1343
30292
14343
15949
figure
bar(byDay{:,{'sum_Westbound','sum_Eastbound'}})
legend({'Westbound','Eastbound'},'Location','eastoutside')
10 Timetables
10-66
Analyze by Day of Week and Time of Day
Examine the data based on different intervals such as day of the week and time of day. Determine the
total counts per day using varfun to perform grouped calculations on variables. Specify the sum
function with a function handle and the grouping variable and preferred output type using namevalue pairs.
byDay = varfun(@sum,bikeData,'GroupingVariables','Day',...
'OutputFormat','table')
byDay=7×5 table
Day
GroupCount
sum_Total
sum_Westbound
sum_Eastbound
_________
__________
_________
_____________
_____________
Sunday
1344
25315
12471
12844
Monday
1343
79991
39219
40772
Tuesday
1320
81480
39695
41785
Wednesday
1344
86853
41726
45127
Thursday
1344
87516
42682
44834
Friday
1342
76643
36926
39717
Saturday
1343
30292
14343
15949
figure
bar(byDay{:,{'sum_Westbound','sum_Eastbound'}})
legend({'Westbound','Eastbound'},'Location','eastoutside')
10 Timetables
10-66