

bikeData.Properties.DimensionNames = {'Time' 'Data'};
bikeData.Properties
ans =
TimetableProperties with properties:
Description: ''
UserData: []
DimensionNames: {'Time' 'Data'}
VariableNames: {'Day' 'Total' 'Westbound' 'Eastbound'}
VariableDescriptions: {}
VariableUnits: {}
VariableContinuity: []
RowTimes: [9387x1 datetime]
StartTime: 2015-06-24 00:00:00
SampleRate: NaN
TimeStep: NaN
CustomProperties: No custom properties are set.
Use addprop and rmprop to modify CustomProperties.
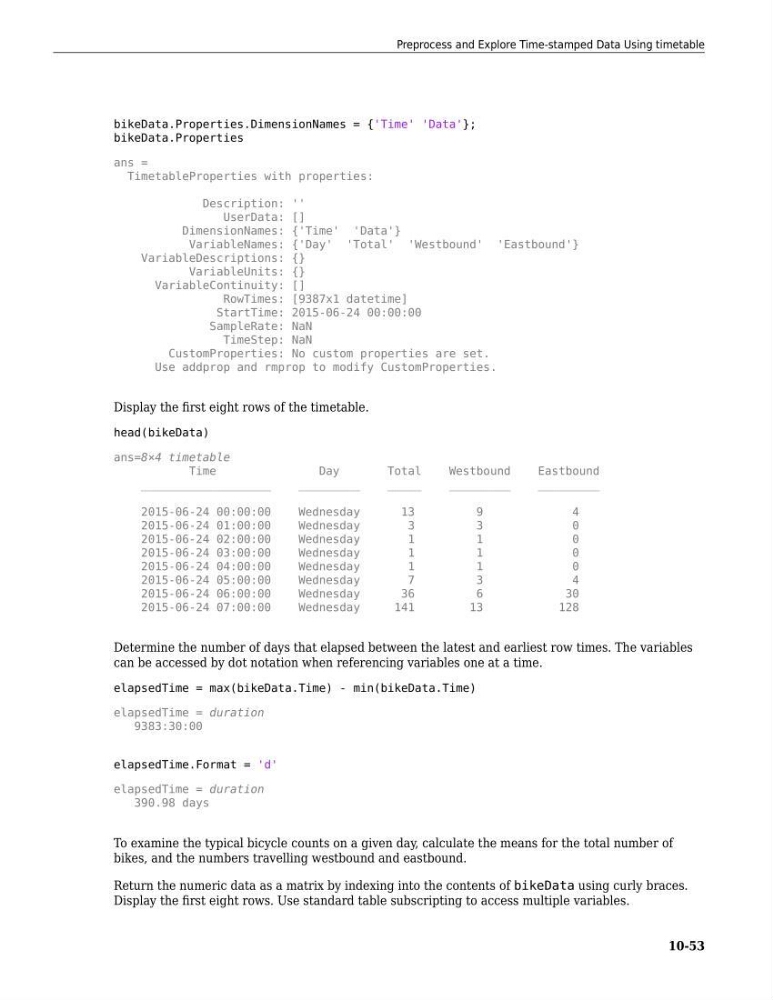
Display the first eight rows of the timetable.
head(bikeData)
ans=8×4 timetable
Time
Day
Total
Westbound
Eastbound
___________________
_________
_____
_________
_________
2015-06-24 00:00:00
Wednesday
13
9
4
2015-06-24 01:00:00
Wednesday
3
3
0
2015-06-24 02:00:00
Wednesday
1
1
0
2015-06-24 03:00:00
Wednesday
1
1
0
2015-06-24 04:00:00
Wednesday
1
1
0
2015-06-24 05:00:00
Wednesday
7
3
4
2015-06-24 06:00:00
Wednesday
36
6
30
2015-06-24 07:00:00
Wednesday
141
13
128
Determine the number of days that elapsed between the latest and earliest row times. The variables
can be accessed by dot notation when referencing variables one at a time.
elapsedTime = max(bikeData.Time) - min(bikeData.Time)
elapsedTime = duration
9383:30:00
elapsedTime.Format = 'd'
elapsedTime = duration
390.98 days
To examine the typical bicycle counts on a given day, calculate the means for the total number of
bikes, and the numbers travelling westbound and eastbound.
Return the numeric data as a matrix by indexing into the contents of bikeData using curly braces.
Display the first eight rows. Use standard table subscripting to access multiple variables.
Preprocess and Explore Time-stamped Data Using timetable
10-53
bikeData.Properties
ans =
TimetableProperties with properties:
Description: ''
UserData: []
DimensionNames: {'Time' 'Data'}
VariableNames: {'Day' 'Total' 'Westbound' 'Eastbound'}
VariableDescriptions: {}
VariableUnits: {}
VariableContinuity: []
RowTimes: [9387x1 datetime]
StartTime: 2015-06-24 00:00:00
SampleRate: NaN
TimeStep: NaN
CustomProperties: No custom properties are set.
Use addprop and rmprop to modify CustomProperties.
Display the first eight rows of the timetable.
head(bikeData)
ans=8×4 timetable
Time
Day
Total
Westbound
Eastbound
___________________
_________
_____
_________
_________
2015-06-24 00:00:00
Wednesday
13
9
4
2015-06-24 01:00:00
Wednesday
3
3
0
2015-06-24 02:00:00
Wednesday
1
1
0
2015-06-24 03:00:00
Wednesday
1
1
0
2015-06-24 04:00:00
Wednesday
1
1
0
2015-06-24 05:00:00
Wednesday
7
3
4
2015-06-24 06:00:00
Wednesday
36
6
30
2015-06-24 07:00:00
Wednesday
141
13
128
Determine the number of days that elapsed between the latest and earliest row times. The variables
can be accessed by dot notation when referencing variables one at a time.
elapsedTime = max(bikeData.Time) - min(bikeData.Time)
elapsedTime = duration
9383:30:00
elapsedTime.Format = 'd'
elapsedTime = duration
390.98 days
To examine the typical bicycle counts on a given day, calculate the means for the total number of
bikes, and the numbers travelling westbound and eastbound.
Return the numeric data as a matrix by indexing into the contents of bikeData using curly braces.
Display the first eight rows. Use standard table subscripting to access multiple variables.
Preprocess and Explore Time-stamped Data Using timetable
10-53