

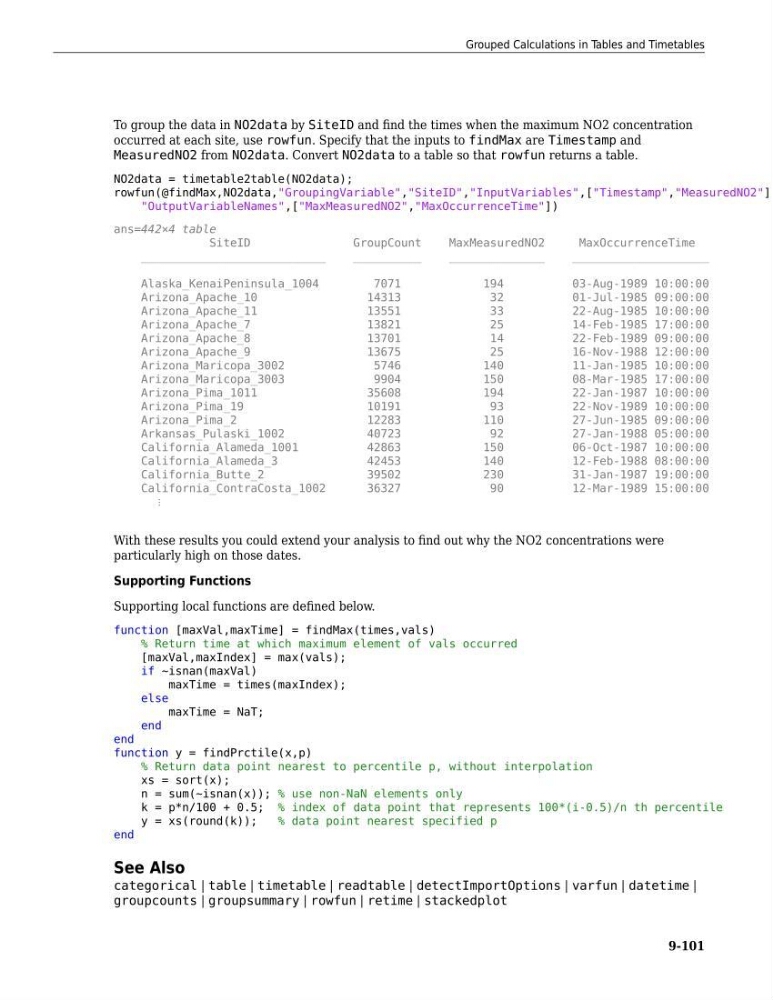
To group the data in NO2data by SiteID and find the times when the maximum NO2 concentration
occurred at each site, use rowfun. Specify that the inputs to findMax are Timestamp and
MeasuredNO2 from NO2data. Convert NO2data to a table so that rowfun returns a table.
NO2data = timetable2table(NO2data);
rowfun(@findMax,NO2data,"GroupingVariable","SiteID","InputVariables",["Timestamp","MeasuredNO2"],
"OutputVariableNames",["MaxMeasuredNO2","MaxOccurrenceTime"])
ans=442×4 table
SiteID
GroupCount
MaxMeasuredNO2
MaxOccurrenceTime
___________________________
__________
______________
____________________
Alaska_KenaiPeninsula_1004
7071
194
03-Aug-1989 10:00:00
Arizona_Apache_10
14313
32
01-Jul-1985 09:00:00
Arizona_Apache_11
13551
33
22-Aug-1985 10:00:00
Arizona_Apache_7
13821
25
14-Feb-1985 17:00:00
Arizona_Apache_8
13701
14
22-Feb-1989 09:00:00
Arizona_Apache_9
13675
25
16-Nov-1988 12:00:00
Arizona_Maricopa_3002
5746
140
11-Jan-1985 10:00:00
Arizona_Maricopa_3003
9904
150
08-Mar-1985 17:00:00
Arizona_Pima_1011
35608
194
22-Jan-1987 10:00:00
Arizona_Pima_19
10191
93
22-Nov-1989 10:00:00
Arizona_Pima_2
12283
110
27-Jun-1985 09:00:00
Arkansas_Pulaski_1002
40723
92
27-Jan-1988 05:00:00
California_Alameda_1001
42863
150
06-Oct-1987 10:00:00
California_Alameda_3
42453
140
12-Feb-1988 08:00:00
California_Butte_2
39502
230
31-Jan-1987 19:00:00
California_ContraCosta_1002
36327
90
12-Mar-1989 15:00:00
⋮
With these results you could extend your analysis to find out why the NO2 concentrations were
particularly high on those dates.
Supporting Functions
Supporting local functions are defined below.
function [maxVal,maxTime] = findMax(times,vals)
% Return time at which maximum element of vals occurred
[maxVal,maxIndex] = max(vals);
if ~isnan(maxVal)
maxTime = times(maxIndex);
else
maxTime = NaT;
end
end
function y = findPrctile(x,p)
% Return data point nearest to percentile p, without interpolation
xs = sort(x);
n = sum(~isnan(x)); % use non-NaN elements only
k = p*n/100 + 0.5; % index of data point that represents 100*(i-0.5)/n th percentile
y = xs(round(k));
% data point nearest specified p
end
See Also
categorical | table | timetable | readtable | detectImportOptions | varfun | datetime |
groupcounts | groupsummary | rowfun | retime | stackedplot
Grouped Calculations in Tables and Timetables
9-101
occurred at each site, use rowfun. Specify that the inputs to findMax are Timestamp and
MeasuredNO2 from NO2data. Convert NO2data to a table so that rowfun returns a table.
NO2data = timetable2table(NO2data);
rowfun(@findMax,NO2data,"GroupingVariable","SiteID","InputVariables",["Timestamp","MeasuredNO2"],
"OutputVariableNames",["MaxMeasuredNO2","MaxOccurrenceTime"])
ans=442×4 table
SiteID
GroupCount
MaxMeasuredNO2
MaxOccurrenceTime
___________________________
__________
______________
____________________
Alaska_KenaiPeninsula_1004
7071
194
03-Aug-1989 10:00:00
Arizona_Apache_10
14313
32
01-Jul-1985 09:00:00
Arizona_Apache_11
13551
33
22-Aug-1985 10:00:00
Arizona_Apache_7
13821
25
14-Feb-1985 17:00:00
Arizona_Apache_8
13701
14
22-Feb-1989 09:00:00
Arizona_Apache_9
13675
25
16-Nov-1988 12:00:00
Arizona_Maricopa_3002
5746
140
11-Jan-1985 10:00:00
Arizona_Maricopa_3003
9904
150
08-Mar-1985 17:00:00
Arizona_Pima_1011
35608
194
22-Jan-1987 10:00:00
Arizona_Pima_19
10191
93
22-Nov-1989 10:00:00
Arizona_Pima_2
12283
110
27-Jun-1985 09:00:00
Arkansas_Pulaski_1002
40723
92
27-Jan-1988 05:00:00
California_Alameda_1001
42863
150
06-Oct-1987 10:00:00
California_Alameda_3
42453
140
12-Feb-1988 08:00:00
California_Butte_2
39502
230
31-Jan-1987 19:00:00
California_ContraCosta_1002
36327
90
12-Mar-1989 15:00:00
⋮
With these results you could extend your analysis to find out why the NO2 concentrations were
particularly high on those dates.
Supporting Functions
Supporting local functions are defined below.
function [maxVal,maxTime] = findMax(times,vals)
% Return time at which maximum element of vals occurred
[maxVal,maxIndex] = max(vals);
if ~isnan(maxVal)
maxTime = times(maxIndex);
else
maxTime = NaT;
end
end
function y = findPrctile(x,p)
% Return data point nearest to percentile p, without interpolation
xs = sort(x);
n = sum(~isnan(x)); % use non-NaN elements only
k = p*n/100 + 0.5; % index of data point that represents 100*(i-0.5)/n th percentile
y = xs(round(k));
% data point nearest specified p
end
See Also
categorical | table | timetable | readtable | detectImportOptions | varfun | datetime |
groupcounts | groupsummary | rowfun | retime | stackedplot
Grouped Calculations in Tables and Timetables
9-101