

0
1826
11.067
5
⋮
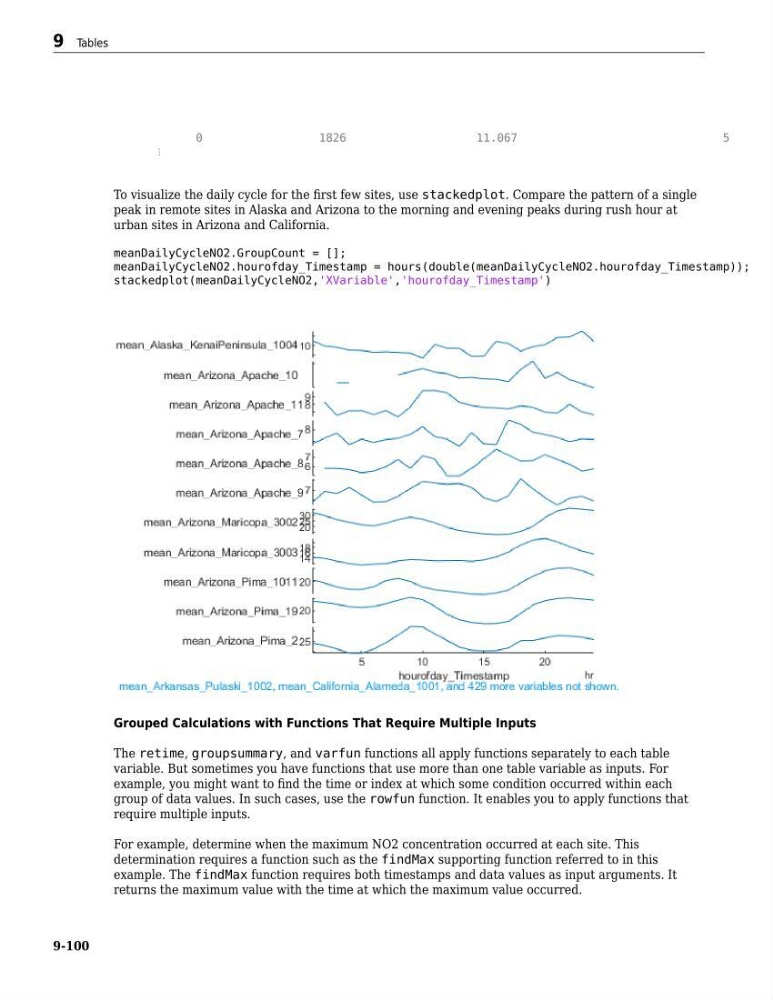
To visualize the daily cycle for the first few sites, use stackedplot. Compare the pattern of a single
peak in remote sites in Alaska and Arizona to the morning and evening peaks during rush hour at
urban sites in Arizona and California.
meanDailyCycleNO2.GroupCount = [];
meanDailyCycleNO2.hourofday_Timestamp = hours(double(meanDailyCycleNO2.hourofday_Timestamp));
stackedplot(meanDailyCycleNO2,'XVariable','hourofday_Timestamp')
Grouped Calculations with Functions That Require Multiple Inputs
The retime, groupsummary, and varfun functions all apply functions separately to each table
variable. But sometimes you have functions that use more than one table variable as inputs. For
example, you might want to find the time or index at which some condition occurred within each
group of data values. In such cases, use the rowfun function. It enables you to apply functions that
require multiple inputs.
For example, determine when the maximum NO2 concentration occurred at each site. This
determination requires a function such as the findMax supporting function referred to in this
example. The findMax function requires both timestamps and data values as input arguments. It
returns the maximum value with the time at which the maximum value occurred.
9 Tables
9-100
1826
11.067
5
⋮
To visualize the daily cycle for the first few sites, use stackedplot. Compare the pattern of a single
peak in remote sites in Alaska and Arizona to the morning and evening peaks during rush hour at
urban sites in Arizona and California.
meanDailyCycleNO2.GroupCount = [];
meanDailyCycleNO2.hourofday_Timestamp = hours(double(meanDailyCycleNO2.hourofday_Timestamp));
stackedplot(meanDailyCycleNO2,'XVariable','hourofday_Timestamp')
Grouped Calculations with Functions That Require Multiple Inputs
The retime, groupsummary, and varfun functions all apply functions separately to each table
variable. But sometimes you have functions that use more than one table variable as inputs. For
example, you might want to find the time or index at which some condition occurred within each
group of data values. In such cases, use the rowfun function. It enables you to apply functions that
require multiple inputs.
For example, determine when the maximum NO2 concentration occurred at each site. This
determination requires a function such as the findMax supporting function referred to in this
example. The findMax function requires both timestamps and data values as input arguments. It
returns the maximum value with the time at which the maximum value occurred.
9 Tables
9-100