

___________
__________________________
_________________
_________________
______
01-Jan-1985
NaN
27
29
01-Jan-1986
NaN
13
14
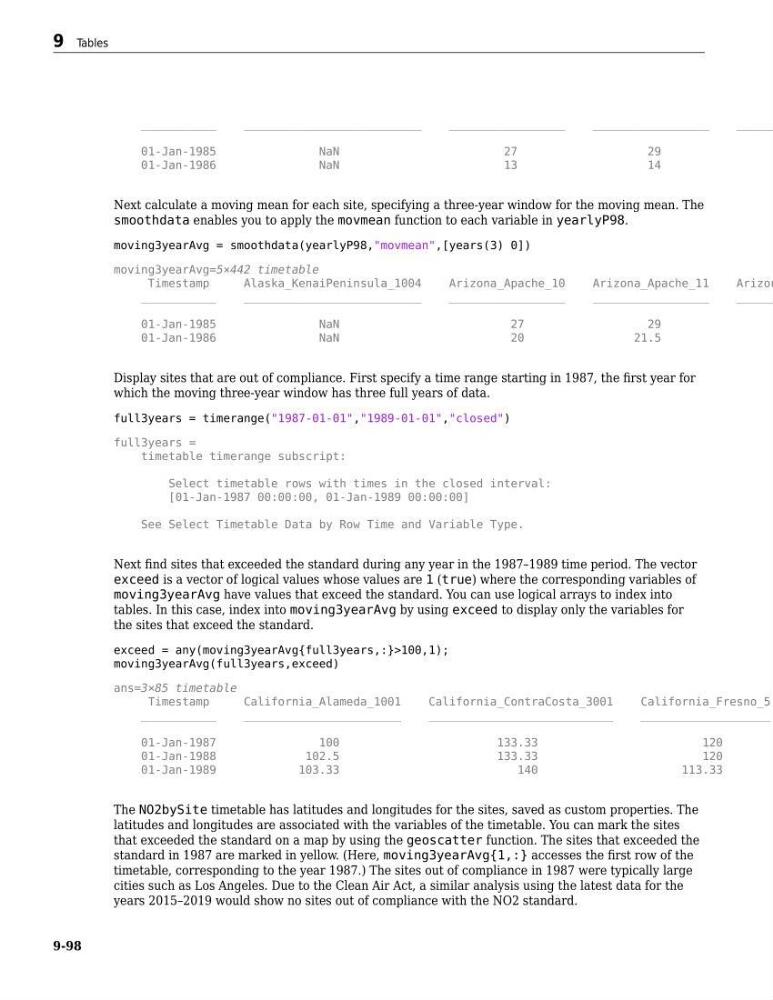
Next calculate a moving mean for each site, specifying a three-year window for the moving mean. The
smoothdata enables you to apply the movmean function to each variable in yearlyP98.
moving3yearAvg = smoothdata(yearlyP98,"movmean",[years(3) 0])
moving3yearAvg=5×442 timetable
Timestamp
Alaska_KenaiPeninsula_1004
Arizona_Apache_10
Arizona_Apache_11
Arizon
___________
__________________________
_________________
_________________
______
01-Jan-1985
NaN
27
29
01-Jan-1986
NaN
20
21.5
Display sites that are out of compliance. First specify a time range starting in 1987, the first year for
which the moving three-year window has three full years of data.
full3years = timerange("1987-01-01","1989-01-01","closed")
full3years =
timetable timerange subscript:
Select timetable rows with times in the closed interval:
[01-Jan-1987 00:00:00, 01-Jan-1989 00:00:00]
See Select Timetable Data by Row Time and Variable Type.
Next find sites that exceeded the standard during any year in the 1987–1989 time period. The vector
exceed is a vector of logical values whose values are 1 (true) where the corresponding variables of
moving3yearAvg have values that exceed the standard. You can use logical arrays to index into
tables. In this case, index into moving3yearAvg by using exceed to display only the variables for
the sites that exceed the standard.
exceed = any(moving3yearAvg{full3years,:}>100,1);
moving3yearAvg(full3years,exceed)
ans=3×85 timetable
Timestamp
California_Alameda_1001
California_ContraCosta_3001
California_Fresno_5
___________
_______________________
___________________________
___________________
01-Jan-1987
100
133.33
120
01-Jan-1988
102.5
133.33
120
01-Jan-1989
103.33
140
113.33
The NO2bySite timetable has latitudes and longitudes for the sites, saved as custom properties. The
latitudes and longitudes are associated with the variables of the timetable. You can mark the sites
that exceeded the standard on a map by using the geoscatter function. The sites that exceeded the
standard in 1987 are marked in yellow. (Here, moving3yearAvg{1,:} accesses the first row of the
timetable, corresponding to the year 1987.) The sites out of compliance in 1987 were typically large
cities such as Los Angeles. Due to the Clean Air Act, a similar analysis using the latest data for the
years 2015–2019 would show no sites out of compliance with the NO2 standard.
9 Tables
9-98
__________________________
_________________
_________________
______
01-Jan-1985
NaN
27
29
01-Jan-1986
NaN
13
14
Next calculate a moving mean for each site, specifying a three-year window for the moving mean. The
smoothdata enables you to apply the movmean function to each variable in yearlyP98.
moving3yearAvg = smoothdata(yearlyP98,"movmean",[years(3) 0])
moving3yearAvg=5×442 timetable
Timestamp
Alaska_KenaiPeninsula_1004
Arizona_Apache_10
Arizona_Apache_11
Arizon
___________
__________________________
_________________
_________________
______
01-Jan-1985
NaN
27
29
01-Jan-1986
NaN
20
21.5
Display sites that are out of compliance. First specify a time range starting in 1987, the first year for
which the moving three-year window has three full years of data.
full3years = timerange("1987-01-01","1989-01-01","closed")
full3years =
timetable timerange subscript:
Select timetable rows with times in the closed interval:
[01-Jan-1987 00:00:00, 01-Jan-1989 00:00:00]
See Select Timetable Data by Row Time and Variable Type.
Next find sites that exceeded the standard during any year in the 1987–1989 time period. The vector
exceed is a vector of logical values whose values are 1 (true) where the corresponding variables of
moving3yearAvg have values that exceed the standard. You can use logical arrays to index into
tables. In this case, index into moving3yearAvg by using exceed to display only the variables for
the sites that exceed the standard.
exceed = any(moving3yearAvg{full3years,:}>100,1);
moving3yearAvg(full3years,exceed)
ans=3×85 timetable
Timestamp
California_Alameda_1001
California_ContraCosta_3001
California_Fresno_5
___________
_______________________
___________________________
___________________
01-Jan-1987
100
133.33
120
01-Jan-1988
102.5
133.33
120
01-Jan-1989
103.33
140
113.33
The NO2bySite timetable has latitudes and longitudes for the sites, saved as custom properties. The
latitudes and longitudes are associated with the variables of the timetable. You can mark the sites
that exceeded the standard on a map by using the geoscatter function. The sites that exceeded the
standard in 1987 are marked in yellow. (Here, moving3yearAvg{1,:} accesses the first row of the
timetable, corresponding to the year 1987.) The sites out of compliance in 1987 were typically large
cities such as Los Angeles. Due to the Clean Air Act, a similar analysis using the latest data for the
years 2015–2019 would show no sites out of compliance with the NO2 standard.
9 Tables
9-98