

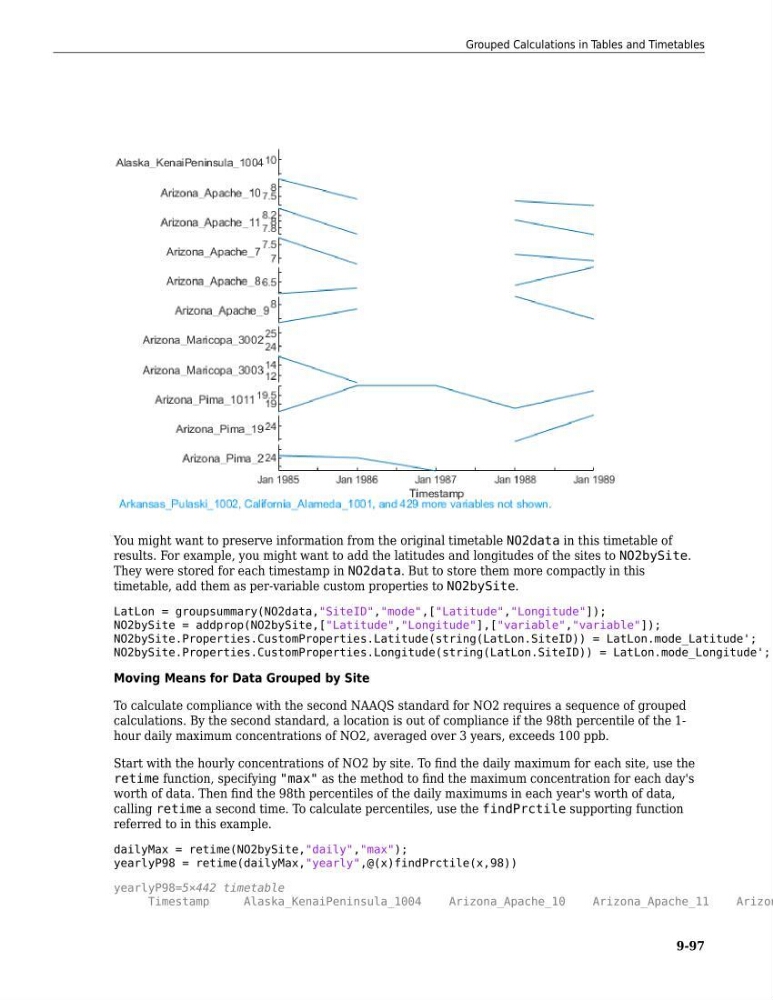
You might want to preserve information from the original timetable NO2data in this timetable of
results. For example, you might want to add the latitudes and longitudes of the sites to NO2bySite.
They were stored for each timestamp in NO2data. But to store them more compactly in this
timetable, add them as per-variable custom properties to NO2bySite.
LatLon = groupsummary(NO2data,"SiteID","mode",["Latitude","Longitude"]);
NO2bySite = addprop(NO2bySite,["Latitude","Longitude"],["variable","variable"]);
NO2bySite.Properties.CustomProperties.Latitude(string(LatLon.SiteID)) = LatLon.mode_Latitude';
NO2bySite.Properties.CustomProperties.Longitude(string(LatLon.SiteID)) = LatLon.mode_Longitude';
Moving Means for Data Grouped by Site
To calculate compliance with the second NAAQS standard for NO2 requires a sequence of grouped
calculations. By the second standard, a location is out of compliance if the 98th percentile of the 1hour daily maximum concentrations of NO2, averaged over 3 years, exceeds 100 ppb.
Start with the hourly concentrations of NO2 by site. To find the daily maximum for each site, use the
retime function, specifying "max" as the method to find the maximum concentration for each day's
worth of data. Then find the 98th percentiles of the daily maximums in each year's worth of data,
calling retime a second time. To calculate percentiles, use the findPrctile supporting function
referred to in this example.
dailyMax = retime(NO2bySite,"daily","max");
yearlyP98 = retime(dailyMax,"yearly",@(x)findPrctile(x,98))
yearlyP98=5×442 timetable
Timestamp
Alaska_KenaiPeninsula_1004
Arizona_Apache_10
Arizona_Apache_11
Arizon
Grouped Calculations in Tables and Timetables
9-97
results. For example, you might want to add the latitudes and longitudes of the sites to NO2bySite.
They were stored for each timestamp in NO2data. But to store them more compactly in this
timetable, add them as per-variable custom properties to NO2bySite.
LatLon = groupsummary(NO2data,"SiteID","mode",["Latitude","Longitude"]);
NO2bySite = addprop(NO2bySite,["Latitude","Longitude"],["variable","variable"]);
NO2bySite.Properties.CustomProperties.Latitude(string(LatLon.SiteID)) = LatLon.mode_Latitude';
NO2bySite.Properties.CustomProperties.Longitude(string(LatLon.SiteID)) = LatLon.mode_Longitude';
Moving Means for Data Grouped by Site
To calculate compliance with the second NAAQS standard for NO2 requires a sequence of grouped
calculations. By the second standard, a location is out of compliance if the 98th percentile of the 1hour daily maximum concentrations of NO2, averaged over 3 years, exceeds 100 ppb.
Start with the hourly concentrations of NO2 by site. To find the daily maximum for each site, use the
retime function, specifying "max" as the method to find the maximum concentration for each day's
worth of data. Then find the 98th percentiles of the daily maximums in each year's worth of data,
calling retime a second time. To calculate percentiles, use the findPrctile supporting function
referred to in this example.
dailyMax = retime(NO2bySite,"daily","max");
yearlyP98 = retime(dailyMax,"yearly",@(x)findPrctile(x,98))
yearlyP98=5×442 timetable
Timestamp
Alaska_KenaiPeninsula_1004
Arizona_Apache_10
Arizona_Apache_11
Arizon
Grouped Calculations in Tables and Timetables
9-97