

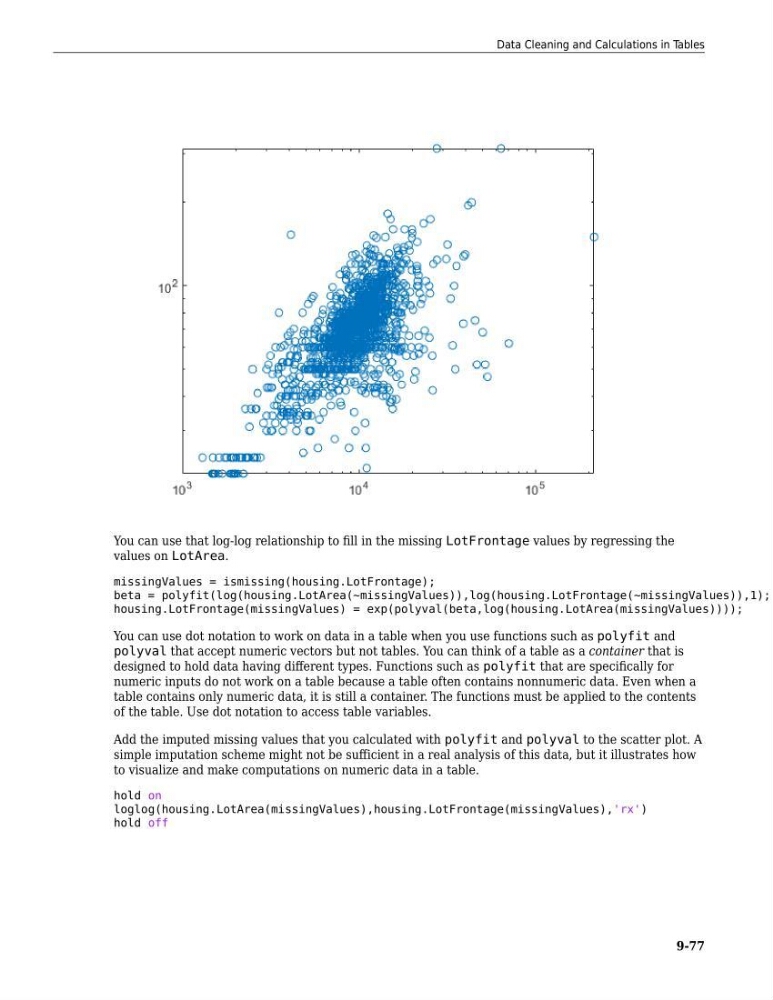
You can use that log-log relationship to fill in the missing LotFrontage values by regressing the
values on LotArea.
missingValues = ismissing(housing.LotFrontage);
beta = polyfit(log(housing.LotArea(~missingValues)),log(housing.LotFrontage(~missingValues)),1);
housing.LotFrontage(missingValues) = exp(polyval(beta,log(housing.LotArea(missingValues))));
You can use dot notation to work on data in a table when you use functions such as polyfit and
polyval that accept numeric vectors but not tables. You can think of a table as a container that is
designed to hold data having different types. Functions such as polyfit that are specifically for
numeric inputs do not work on a table because a table often contains nonnumeric data. Even when a
table contains only numeric data, it is still a container. The functions must be applied to the contents
of the table. Use dot notation to access table variables.
Add the imputed missing values that you calculated with polyfit and polyval to the scatter plot. A
simple imputation scheme might not be sufficient in a real analysis of this data, but it illustrates how
to visualize and make computations on numeric data in a table.
hold on
loglog(housing.LotArea(missingValues),housing.LotFrontage(missingValues),'rx')
hold off
Data Cleaning and Calculations in Tables
9-77
values on LotArea.
missingValues = ismissing(housing.LotFrontage);
beta = polyfit(log(housing.LotArea(~missingValues)),log(housing.LotFrontage(~missingValues)),1);
housing.LotFrontage(missingValues) = exp(polyval(beta,log(housing.LotArea(missingValues))));
You can use dot notation to work on data in a table when you use functions such as polyfit and
polyval that accept numeric vectors but not tables. You can think of a table as a container that is
designed to hold data having different types. Functions such as polyfit that are specifically for
numeric inputs do not work on a table because a table often contains nonnumeric data. Even when a
table contains only numeric data, it is still a container. The functions must be applied to the contents
of the table. Use dot notation to access table variables.
Add the imputed missing values that you calculated with polyfit and polyval to the scatter plot. A
simple imputation scheme might not be sufficient in a real analysis of this data, but it illustrates how
to visualize and make computations on numeric data in a table.
hold on
loglog(housing.LotArea(missingValues),housing.LotFrontage(missingValues),'rx')
hold off
Data Cleaning and Calculations in Tables
9-77