

basement bath values (NaNs, in this case) occur in only two rows. You can remove those two rows by
using the rmmissing function.
missingBsmtBath = ismissing(housing.BsmtFullBath) | ismissing(housing.BsmtHalfBath);
housing(missingBsmtBath,:)
ans=2×24 table
PID
MSSubClass
LotFrontage
LotArea
Neighborhood
____________
_______________________________
___________
_______
____________
"0903230120"
1-STORY 1946 & NEWER ALL STYLES
99
5940
BrkSide
"0908154080"
1-STORY 1946 & NEWER ALL STYLES
123
47007
Edwards
housing = rmmissing(housing,"DataVariables",["BsmtFullBath" "BsmtHalfBath"]);
whos housing
Name
Size
Bytes Class
Attributes
housing
2928x24
595935 table
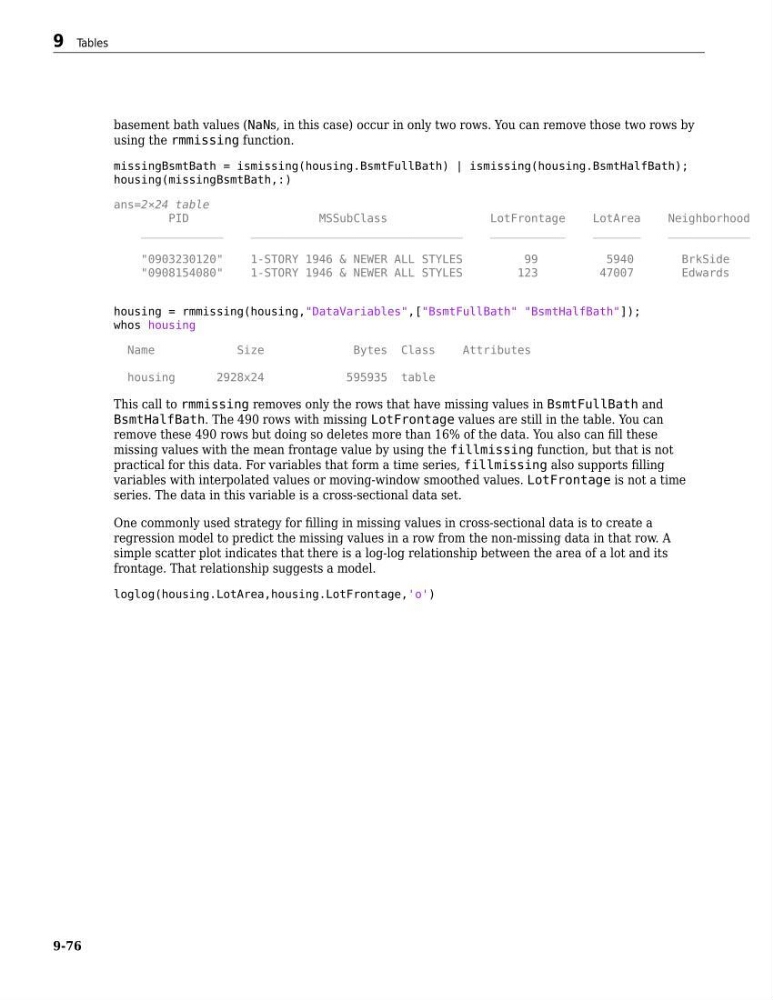
This call to rmmissing removes only the rows that have missing values in BsmtFullBath and
BsmtHalfBath. The 490 rows with missing LotFrontage values are still in the table. You can
remove these 490 rows but doing so deletes more than 16% of the data. You also can fill these
missing values with the mean frontage value by using the fillmissing function, but that is not
practical for this data. For variables that form a time series, fillmissing also supports filling
variables with interpolated values or moving-window smoothed values. LotFrontage is not a time
series. The data in this variable is a cross-sectional data set.
One commonly used strategy for filling in missing values in cross-sectional data is to create a
regression model to predict the missing values in a row from the non-missing data in that row. A
simple scatter plot indicates that there is a log-log relationship between the area of a lot and its
frontage. That relationship suggests a model.
loglog(housing.LotArea,housing.LotFrontage,'o')
9 Tables
9-76
using the rmmissing function.
missingBsmtBath = ismissing(housing.BsmtFullBath) | ismissing(housing.BsmtHalfBath);
housing(missingBsmtBath,:)
ans=2×24 table
PID
MSSubClass
LotFrontage
LotArea
Neighborhood
____________
_______________________________
___________
_______
____________
"0903230120"
1-STORY 1946 & NEWER ALL STYLES
99
5940
BrkSide
"0908154080"
1-STORY 1946 & NEWER ALL STYLES
123
47007
Edwards
housing = rmmissing(housing,"DataVariables",["BsmtFullBath" "BsmtHalfBath"]);
whos housing
Name
Size
Bytes Class
Attributes
housing
2928x24
595935 table
This call to rmmissing removes only the rows that have missing values in BsmtFullBath and
BsmtHalfBath. The 490 rows with missing LotFrontage values are still in the table. You can
remove these 490 rows but doing so deletes more than 16% of the data. You also can fill these
missing values with the mean frontage value by using the fillmissing function, but that is not
practical for this data. For variables that form a time series, fillmissing also supports filling
variables with interpolated values or moving-window smoothed values. LotFrontage is not a time
series. The data in this variable is a cross-sectional data set.
One commonly used strategy for filling in missing values in cross-sectional data is to create a
regression model to predict the missing values in a row from the non-missing data in that row. A
simple scatter plot indicates that there is a log-log relationship between the area of a lot and its
frontage. That relationship suggests a model.
loglog(housing.LotArea,housing.LotFrontage,'o')
9 Tables
9-76