

VariableUnits: {}
VariableContinuity: []
RowNames: {}
Custom Properties (access using t.Properties.CustomProperties.):
OutputFileName: 'outageResults'
OutputFileType: '.mat'
ToPlot: [0 0 1 1 0]
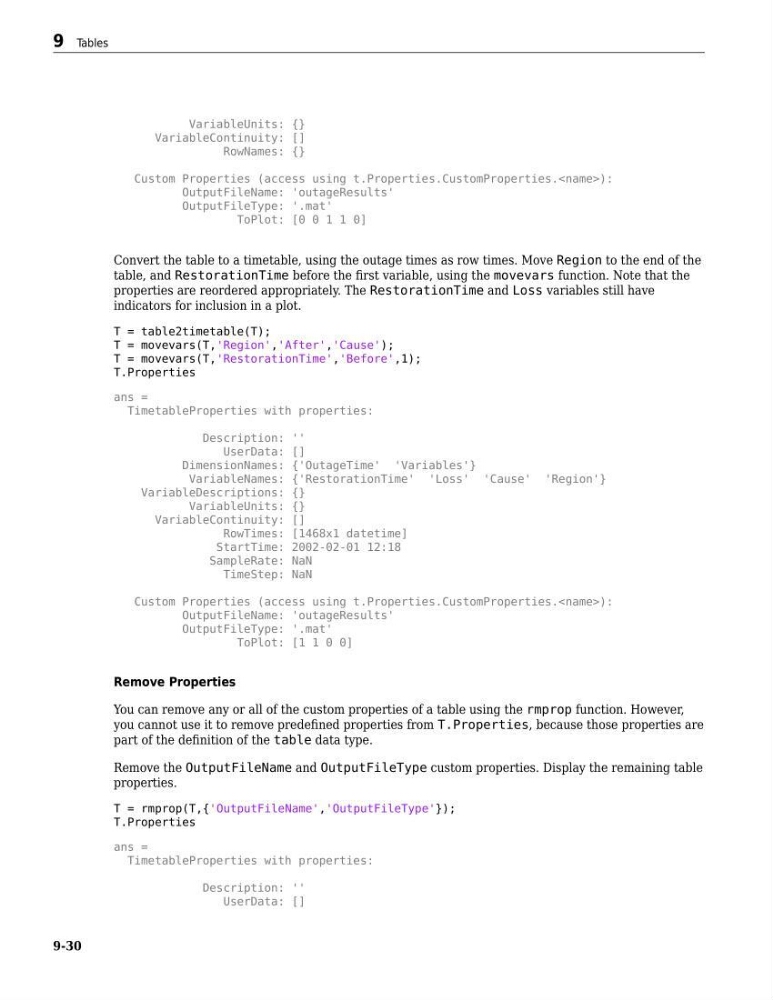
Convert the table to a timetable, using the outage times as row times. Move Region to the end of the
table, and RestorationTime before the first variable, using the movevars function. Note that the
properties are reordered appropriately. The RestorationTime and Loss variables still have
indicators for inclusion in a plot.
T = table2timetable(T);
T = movevars(T,'Region','After','Cause');
T = movevars(T,'RestorationTime','Before',1);
T.Properties
ans =
TimetableProperties with properties:
Description: ''
UserData: []
DimensionNames: {'OutageTime' 'Variables'}
VariableNames: {'RestorationTime' 'Loss' 'Cause' 'Region'}
VariableDescriptions: {}
VariableUnits: {}
VariableContinuity: []
RowTimes: [1468x1 datetime]
StartTime: 2002-02-01 12:18
SampleRate: NaN
TimeStep: NaN
Custom Properties (access using t.Properties.CustomProperties.):
OutputFileName: 'outageResults'
OutputFileType: '.mat'
ToPlot: [1 1 0 0]
Remove Properties
You can remove any or all of the custom properties of a table using the rmprop function. However,
you cannot use it to remove predefined properties from T.Properties, because those properties are
part of the definition of the table data type.
Remove the OutputFileName and OutputFileType custom properties. Display the remaining table
properties.
T = rmprop(T,{'OutputFileName','OutputFileType'});
T.Properties
ans =
TimetableProperties with properties:
Description: ''
UserData: []
9 Tables
9-30
VariableContinuity: []
RowNames: {}
Custom Properties (access using t.Properties.CustomProperties.
OutputFileName: 'outageResults'
OutputFileType: '.mat'
ToPlot: [0 0 1 1 0]
Convert the table to a timetable, using the outage times as row times. Move Region to the end of the
table, and RestorationTime before the first variable, using the movevars function. Note that the
properties are reordered appropriately. The RestorationTime and Loss variables still have
indicators for inclusion in a plot.
T = table2timetable(T);
T = movevars(T,'Region','After','Cause');
T = movevars(T,'RestorationTime','Before',1);
T.Properties
ans =
TimetableProperties with properties:
Description: ''
UserData: []
DimensionNames: {'OutageTime' 'Variables'}
VariableNames: {'RestorationTime' 'Loss' 'Cause' 'Region'}
VariableDescriptions: {}
VariableUnits: {}
VariableContinuity: []
RowTimes: [1468x1 datetime]
StartTime: 2002-02-01 12:18
SampleRate: NaN
TimeStep: NaN
Custom Properties (access using t.Properties.CustomProperties.
OutputFileName: 'outageResults'
OutputFileType: '.mat'
ToPlot: [1 1 0 0]
Remove Properties
You can remove any or all of the custom properties of a table using the rmprop function. However,
you cannot use it to remove predefined properties from T.Properties, because those properties are
part of the definition of the table data type.
Remove the OutputFileName and OutputFileType custom properties. Display the remaining table
properties.
T = rmprop(T,{'OutputFileName','OutputFileType'});
T.Properties
ans =
TimetableProperties with properties:
Description: ''
UserData: []
9 Tables
9-30