

ToPlot: [0 0 1 1 1 0]
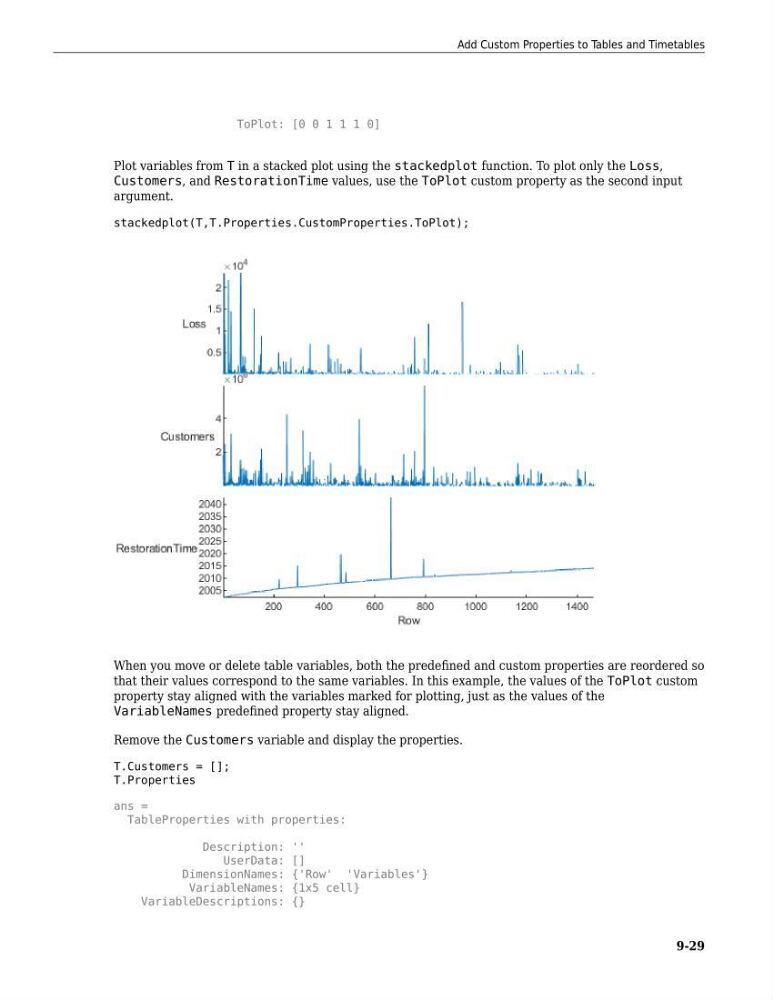
Plot variables from T in a stacked plot using the stackedplot function. To plot only the Loss,
Customers, and RestorationTime values, use the ToPlot custom property as the second input
argument.
stackedplot(T,T.Properties.CustomProperties.ToPlot);
When you move or delete table variables, both the predefined and custom properties are reordered so
that their values correspond to the same variables. In this example, the values of the ToPlot custom
property stay aligned with the variables marked for plotting, just as the values of the
VariableNames predefined property stay aligned.
Remove the Customers variable and display the properties.
T.Customers = [];
T.Properties
ans =
TableProperties with properties:
Description: ''
UserData: []
DimensionNames: {'Row' 'Variables'}
VariableNames: {1x5 cell}
VariableDescriptions: {}
Add Custom Properties to Tables and Timetables
9-29
Plot variables from T in a stacked plot using the stackedplot function. To plot only the Loss,
Customers, and RestorationTime values, use the ToPlot custom property as the second input
argument.
stackedplot(T,T.Properties.CustomProperties.ToPlot);
When you move or delete table variables, both the predefined and custom properties are reordered so
that their values correspond to the same variables. In this example, the values of the ToPlot custom
property stay aligned with the variables marked for plotting, just as the values of the
VariableNames predefined property stay aligned.
Remove the Customers variable and display the properties.
T.Customers = [];
T.Properties
ans =
TableProperties with properties:
Description: ''
UserData: []
DimensionNames: {'Row' 'Variables'}
VariableNames: {1x5 cell}
VariableDescriptions: {}
Add Custom Properties to Tables and Timetables
9-29