

Poor
11
Fair
15
Good
40
Excellent
34
Plot Histogram
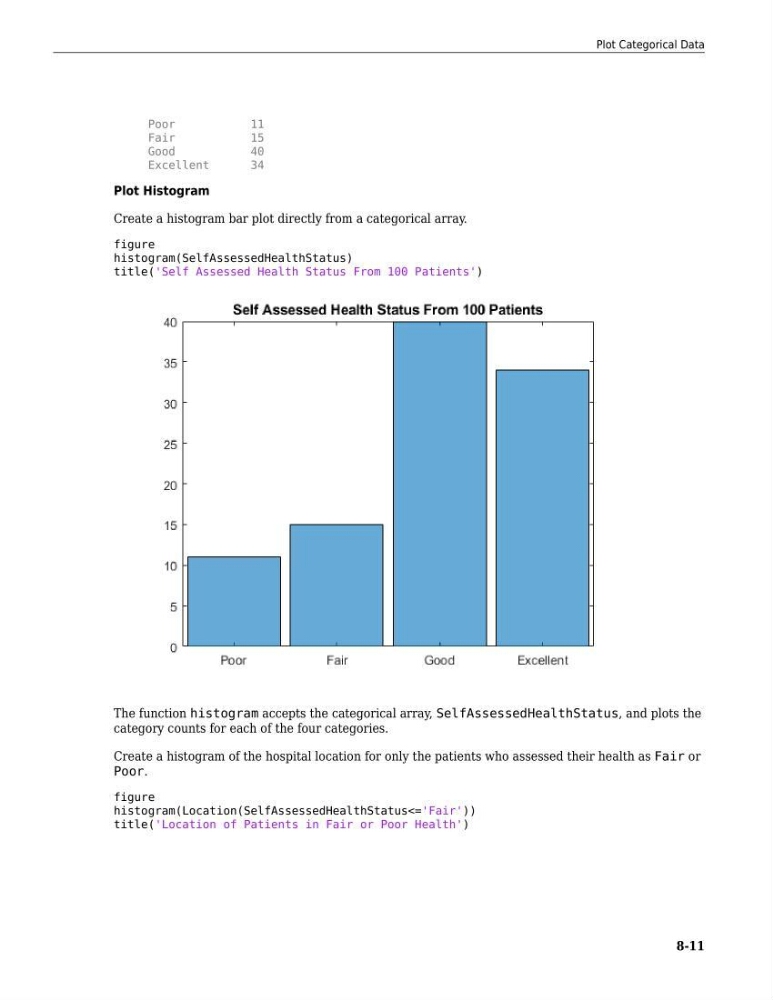
Create a histogram bar plot directly from a categorical array.
figure
histogram(SelfAssessedHealthStatus)
title('Self Assessed Health Status From 100 Patients')
The function histogram accepts the categorical array, SelfAssessedHealthStatus, and plots the
category counts for each of the four categories.
Create a histogram of the hospital location for only the patients who assessed their health as Fair or
Poor.
figure
histogram(Location(SelfAssessedHealthStatus<='Fair'))
title('Location of Patients in Fair or Poor Health')
Plot Categorical Data
8-11
11
Fair
15
Good
40
Excellent
34
Plot Histogram
Create a histogram bar plot directly from a categorical array.
figure
histogram(SelfAssessedHealthStatus)
title('Self Assessed Health Status From 100 Patients')
The function histogram accepts the categorical array, SelfAssessedHealthStatus, and plots the
category counts for each of the four categories.
Create a histogram of the hospital location for only the patients who assessed their health as Fair or
Poor.
figure
histogram(Location(SelfAssessedHealthStatus<='Fair'))
title('Location of Patients in Fair or Poor Health')
Plot Categorical Data
8-11